
Mind map
REPRESENTACION DE LOS DATOS EN FORMA GRAFICA
Map content
REPRESENTACION DE LOS DATOS EN FORMA GRAFICA
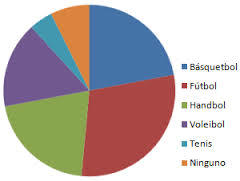
Diagrama Circular
- ejemplo:
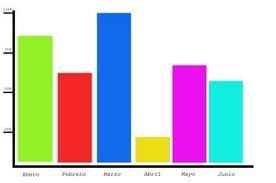
Diagrama de barras
- Ejemplo
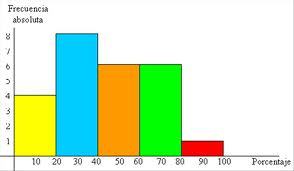
Histograma
- Ejemplo:
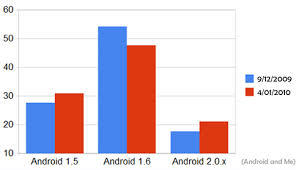
Comparativo de barras
- Ejemplo
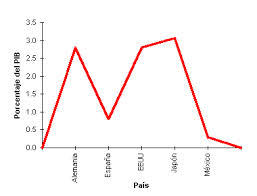
Poligono de frecuencias
- Ejemplo
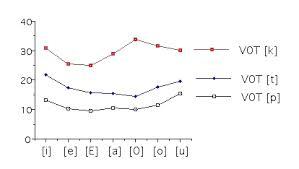
Poligono de frecuencias multiple
- Ejemplo
Images and files in the map
Information
- Description
- Mind Map on REPRESENTACION DE LOS DATOS EN FORMA GRAFICA, created by vale_ortegau on 19/08/2014.
- Created by
- vale_ortegau
- Views
- 10
- Rating