
Notes
Clustering & Dimensionality Reduction
Content of the notes (6)
Page 1
Clustering
Unsupervised Learning
We don't have actual labels
We may have groups, but nothing is defined and there are no correct answers
Why use unsupervised Learning?
Find similar data groups (clusters)
Find outliers in data (anomaly detection)
Reduce the amount of data but keep information (dimensionality reduction)
Clustering Applications
Related search results
Related articles on news sites
market segmentation
Social media clustering
Image segmentation
Sequence analysis
High throughput genotyping
Divide data into groups that "fit" together
Two different methods we will be looking at
Partitioning Methods
Heirachical-Based Methods
Partitioning Methods
Partition the samples into k clusters, and each partition forms one cluster
This method often uses the distance between different samples as a partition criterion
K-means Clustering
The algorithm will categorize the items into k groups of similarity
To calculate the similarity, the Euclidean distance is used as a measurement.
The algorithm works in three significant steps:
Initialization centroids
Initialize K random points to be the center of the cluster
Often, three random points from the dataset are chosen as initial values
2. Categorizing samples
Determine for each sample which is the closest centroid
We do this using the Euclidean distance
3. Update centroids
Update centroid location to the mean of all samples assigned to that centroid
Repeat
Categorize Samples
Update Centroids
Categorize Samples
Update Centroids
Categorize Samples
Results after n iterations
Page 2
K-means Clustering Characteristics
Easy to use, and results are easily interpretable
Sometimes gets stuck at local optima
Final result is dependent on initialized centroids
Try multiple differently initialized models to find the best model (global optima)
Very sensitive to outliers
Problem with not linearly divisible data
Solution: use another clustering algorithm
e.g., Spectral clustering
All sklearn algorithms with example images: sklearn clustering
Determining the Optimal Number of Clusters
Different strategies exist
Visual inspection of data
Silhouette clustering
Elbow method
Elbow Method
Vary the number of clusters, for example, between 1 and 10, and calculate the within-cluster sum of squared errors (WCSSE), where the error is the Euclidean distance between the sample and its centroid.
The "elbow is the best number of clusters
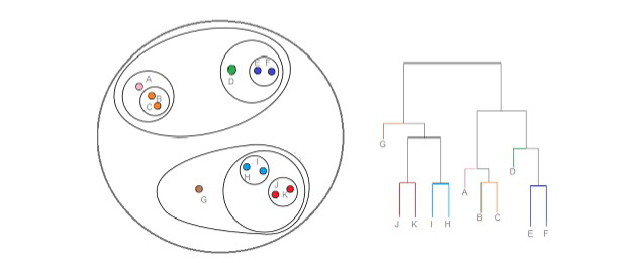
Hierarchical Clustering
This is an essential family of clustering algorithms that build nested clusters by merging or splitting them successively
Can be represented as a tree/ dendrogram
Root is a cluster that contains all samples
Leaves/terminal nodes are clusters that contains a single sample
Page 3
Two Major types of Heirachal Clustering
Agglomerative hierarchical clustering
Combines smaller clusters into larger ones (bottom-up)
Divisive hierarchical clustering
Dividing larger clusters into smaller ones (top-down)
Hierarchical Clustering Advantages
We do not need to know the number of clusters in advance as you can only split, so any times
The structure of the tree can be helpful to (such as a phylogenetic tree)
How do you determine Distances (Links) between clusters?
There are four ways to go about this:
Single linkage
The distance between the closest points of each cluster
Complete Linkage (Maximum Linkage)
The distance between the farthest points of each cluster
Average LInnkage
Minimizes the average of the distance between all observations of pairs of clusters
Ward Linkage (Centroi Linkage)
Similar to K-means but in a hierarchical way
Complexity
Hierarchical clustering is very computationally intensive
Calculations are at least quadratically dependent on the number of data points
Not useable for massive datasets
Page 4
Dimensionality Reduction
What is dimensionality reduction?
The process of dimensionality reduction involves reducing the number of random variables or attributes that are being considered.
Applications
Visualizations (not possible with more than 3 features)
Removing noise
Data compression
"The curse of dimensionality"
Some models do not perform well with a lot of different features
Algorithms
Principal component analysis (PCA)
Linear Discriminant Analysis (LDA)
Multidimensional scaling (MDS)
Uniform Manifold Approximation and Projection (UMAP)
t-distributed stochastic neighbor embedding (t-SNE)
Autoencoders (special neural network)
Cheap or easy ways
Missing values Ratio
Low variance filter
These will just tell you if a column is useful or not and remove them
Why would we want to use the above algorithms?
Practical examples
Classification of genes
Face recognition (reduces pixels)
Voice recognition
Handwriting recognition
Compression
(outlier detection)
Page 5
Principal Component Analysis
PCA transforms several features into more minorPrincipal Component Analysis (PCA) is a technique that helps to reduce the complexity of a dataset by transforming several interrelated features into a set of new, non-correlated features, also called principal components. This method aims to retain as much information as possible while reducing the number of variables in the dataset. non-correlated features, also called principal components, while preserving as much information as possible.
How to conduct principal component analysis
Determine the axis where there is the most variance.
This axis becomes principal component 1. The perpendicular axis becomes principal
component 2. This can also be scaled up to higher dimensions
The axis is determined based on the smallest SSE.
Rotate to this axis and scale it so that the points are centered around 0,0
Reconstruction of data using PCA
I need a break bro
Page 6
What is Multidimensional scaling (MDS)?
Attempts to model similarity or dissimilarity data as distances in a
geometric space. It tries to keep the distance between data similar to
the distance in the higher-order dataset
t-distributed Stochastic Neighbor Embedding
Converts affinities (similarities) to probabilities
Advantages:
• Revealing the structure at many scales on a single map
• Revealing data that lie in multiple, different manifolds or clusters
• Reducing the tendency to crowd points together at the center
Disadvantages:
• Computationally expensive (=slow, several hours on million-sample
datasets vs. seconds for PCA)
• Stochastic and different seeds can give different results
Main purpose:
Visualizing high-dimensional data in 2D or 3D
Information
- Description
- exam Machine Learning Note on Clustering & Dimensionality Reduction, created by Laura BURGOS on 10/03/2024.
- Created by
- Laura BURGOS
- Views
- 0
- Rating