
Notes
Special Supply Curves
Content of the notes (1)
Page 1
Special Supply Curves
These curves occur when a product's supply cannot be changed in the short run, regardless of any change in the market price.
While these are uncommon, they do occur
e.g. The fish market is one example; there is only so many fish that can be caught (because of quotas and, also, the fact that there's a finite amount of fish in the sea) - even if the price of fish rose significantly, there would still only be so many that could be supplied, resulting in a vertical supply curve shown below
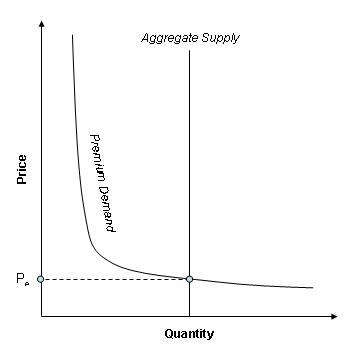
As shown in this diagram, regardless of fluctuations in price, the quantity supplied is fixed at the same quantity for any price
Certain situations arise when there is a minimum price below which suppliers will not be willing to enter the market
This results in a strange shaped supply curve where, up to a certain quantity, the supply curve will be horizontal, and then after that the supply curve will follow its normal trajectory
e.g. The minimum wage - labour will not be supplied below the minimum wage "price" level
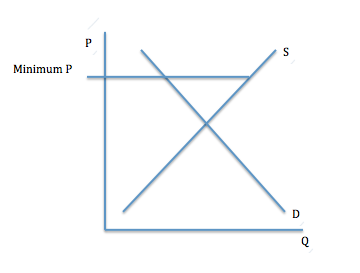
Here, the supply curve's shape is distorted due to the presence of a minimum price.
The supply is actually the flat line (Minimum P on diagram) up until it meets the curve S, and then continues on an upward left to right trajectory.
The reason for the eventual trajectory is that only a certain amount of labour will be willing to work at the minimum price, once you reach a certain quantity of labour, a higher price will have to be paid to supply more labour
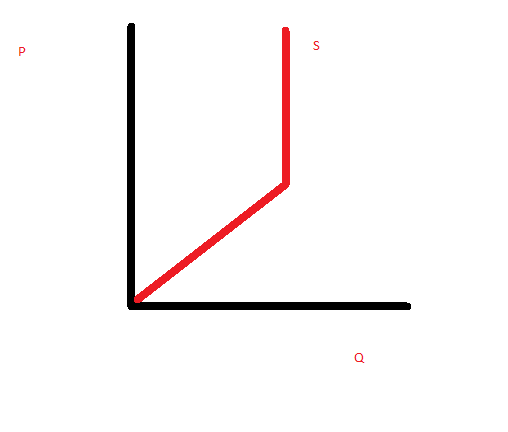
Certain situations arise when there is a certain point after which there can be no further increase in quantity supplied because the supplier has reached maximum production capacity, even if prices continue to increase.
This is displayed visually below
What do we mean by "special"?
There are a few situations which will result in a strange looking supply curve (one that doesn't follow the normal "upward sloping from left to right" trajectory
The Curves we will Focus On Are
1) Curves when there is fixed supply
2) Curves when there is a minimum price
3) Curves when there is a limited capacity
Curves When There is Fixed Supply
Curves Where There is a Minimum Price
Curves Where There is Limited Capacity
Special Supply Curves
Information
- Description
- There are some supply curves which look different to the conventional supply curve. This note gives diagrams and explanations for each of these. This is helpful for anyone studying late-secondary level economics
- Created by
- eleanor.adamandi · Dec 2013
- Updated
- Jan 10, 2017
- Views
- 35
- Tags
- History
-
- Created by jackexamtime · Dec 16, 2013
- Copied by eleanor.adamandi · Dec 16, 2013
- Rating