
Flowchart
Temperature change of reacting solutions
Flowchart content
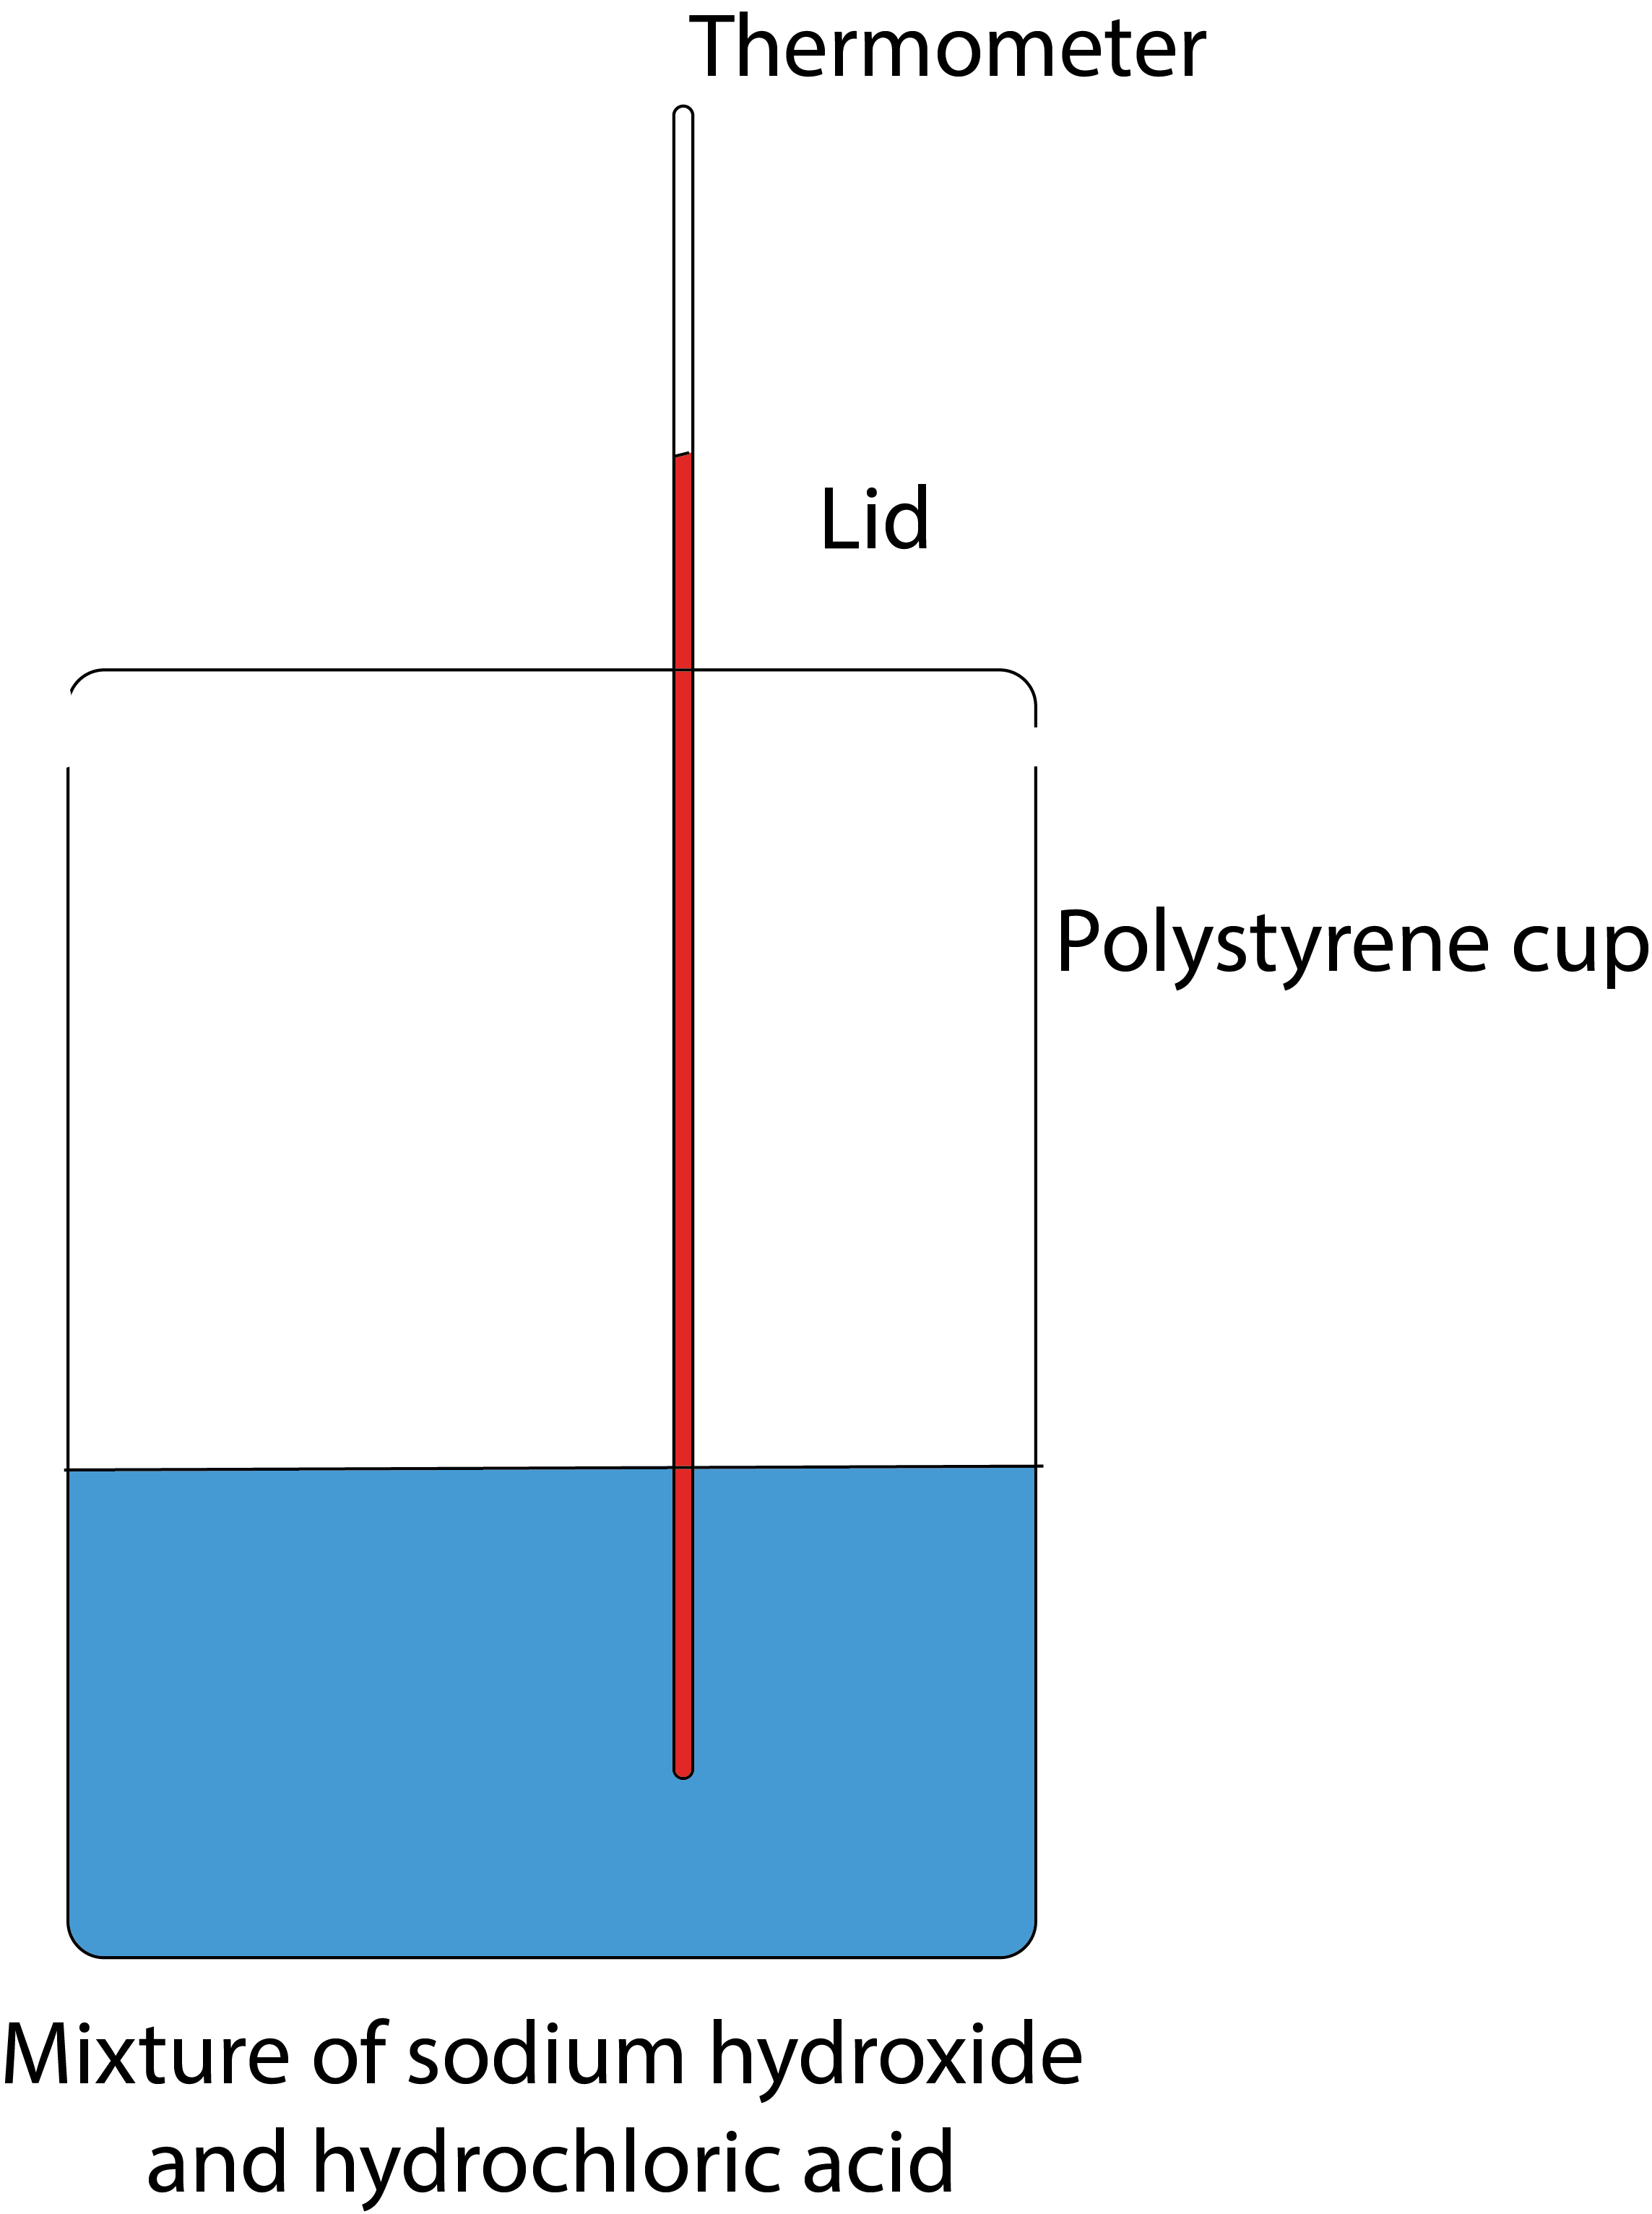
To investigate the temperature change of reacting solutions
Do not record the end temperature until you are sure that the temperature of the mixture has stopped increasing
Polystyrene is a thermal insulator
Less heat escapes reaction container
Measurements are more accurate
Repeat the experiment, using a constant volume of hydrochloric acid, but a different volume of sodium hydroxide each time
Draw a graph of temperature change vs volume added
This graph can be used to calculate the volume of sodium hydroxide that would need to be added to attain a given temperature change
Information
- Description
- User has deleted their subject information Flowchart on Temperature change of reacting solutions, created by Deleted user on 24/07/2017.
- Created by
- Deleted user · Jul 2017
- Updated
- Jul 24, 2017
- Views
- 20
- History
-
- Created by Niamh Ryan · Jul 21, 2017
- Copied by Niamh Ryan · Jul 24, 2017
- Rating