
Notes
Ishikawa Diagrams Note
Content of the notes (3)
Page 1
Introduction to Ishikawa Diagrams
Also sometimes known as fishbone diagrams or herringbone diagrams
Benefits:
Shows the causes of an event
Demonstrates where quality issues might arise
Allows management to determine which issues have to be addressed in order to gain or avoid a particular event
Determine which resources are required at specific times
Drawbacks:
Not useful for complex problems
Based on opinion not evidence
Assumes problem is composed of a limited number of causes only
To successfully build a Ishikawa diagram:
Everyone must agree on what the problem is
Each line of causality must be pursued back to its root cause
Emptier branches should be grafted onto others and overcrowded ones should be split up
Page 2
Steps involved in building an Ishikawa Diagram
1. Write the problem to be solved on one side of the workspace (known as the effect), then draw the backbone of the fish
2. Decide how to categorise the causes
Manufacturing industry usually uses:
Machine
Method
Materials
Measurement
Man(People)
Medium (Environment)
Services industry usually uses the same categories but:
Remove:
Machine
Method
Replace with:
Policies (High level decisions and rules)
Procedures (Specific tasks)
3. Group potential causes into categories and sub categories
Sub categories can come from
Brainstorming, calling on prior experience of team
Data collected from check sheets or other sources
4. Quantify the relationship between the primary root causes and the effect
Regression analysis to quantify correlation
Designed experiments to quantify causation
Page 3
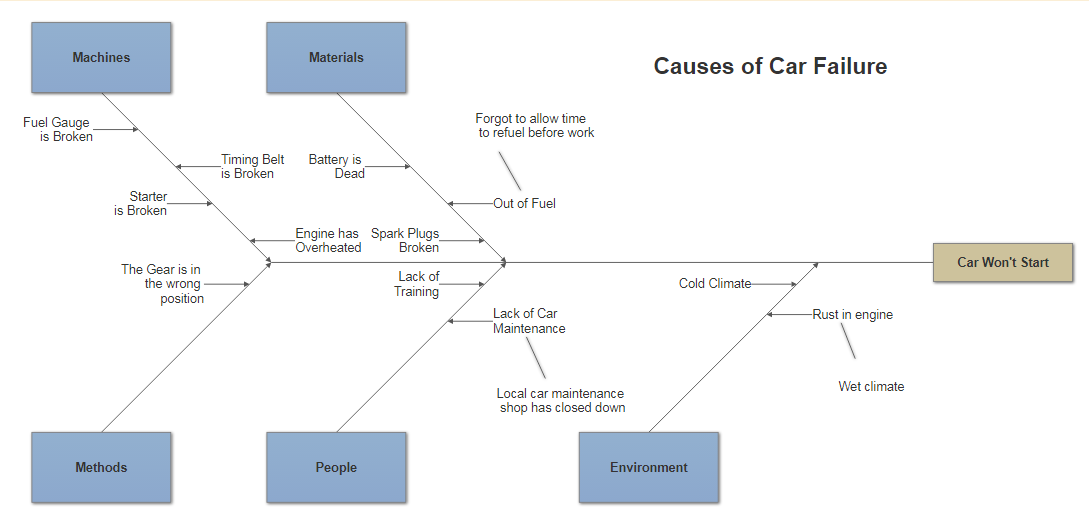
Example of an Ishikawa Diagram
Information
- Description
- User has deleted their subject information Note on Ishikawa Diagrams Note, created by Deleted user on 27/07/2017.
- Created by
- Deleted user · Jul 2017
- Updated
- Jul 27, 2017
- Views
- 127
- History
-
- Created by Niamh Ryan · Jul 26, 2017
- Copied to Note by Niamh Ryan · Jul 26, 2017
- Copied by Niamh Ryan · Jul 27, 2017
- Rating