
Notes
Graphical Representations of Differentiation
Content of the notes (6)
Page 1
Gradients and Tangents
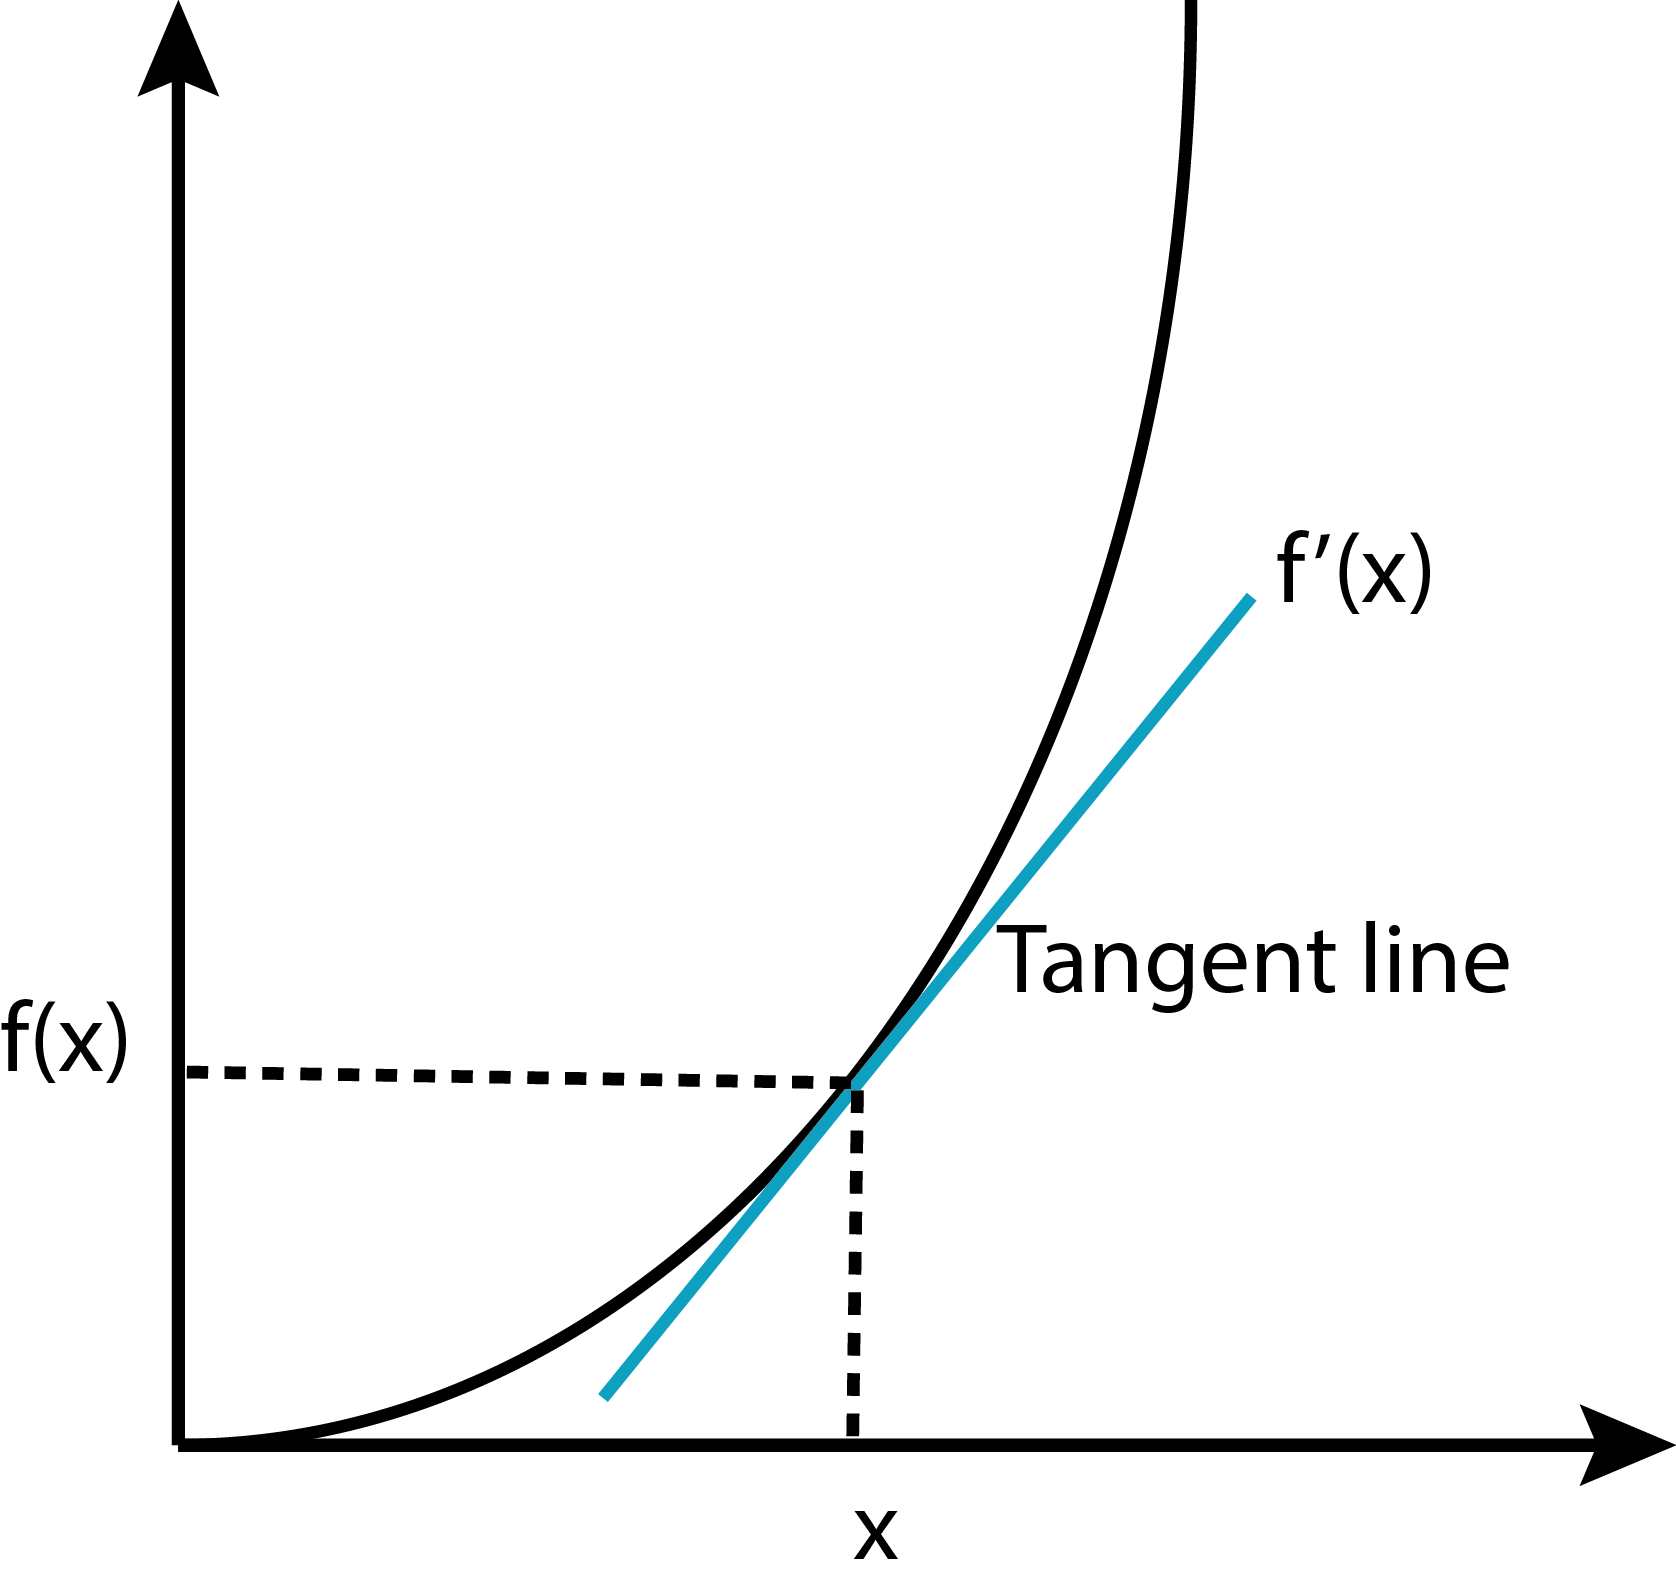
The derivative of a function can be interpreted as the gradient of a function at that point.
This means that if we were to graph the function, we could use the derivative to find its slope at any point.
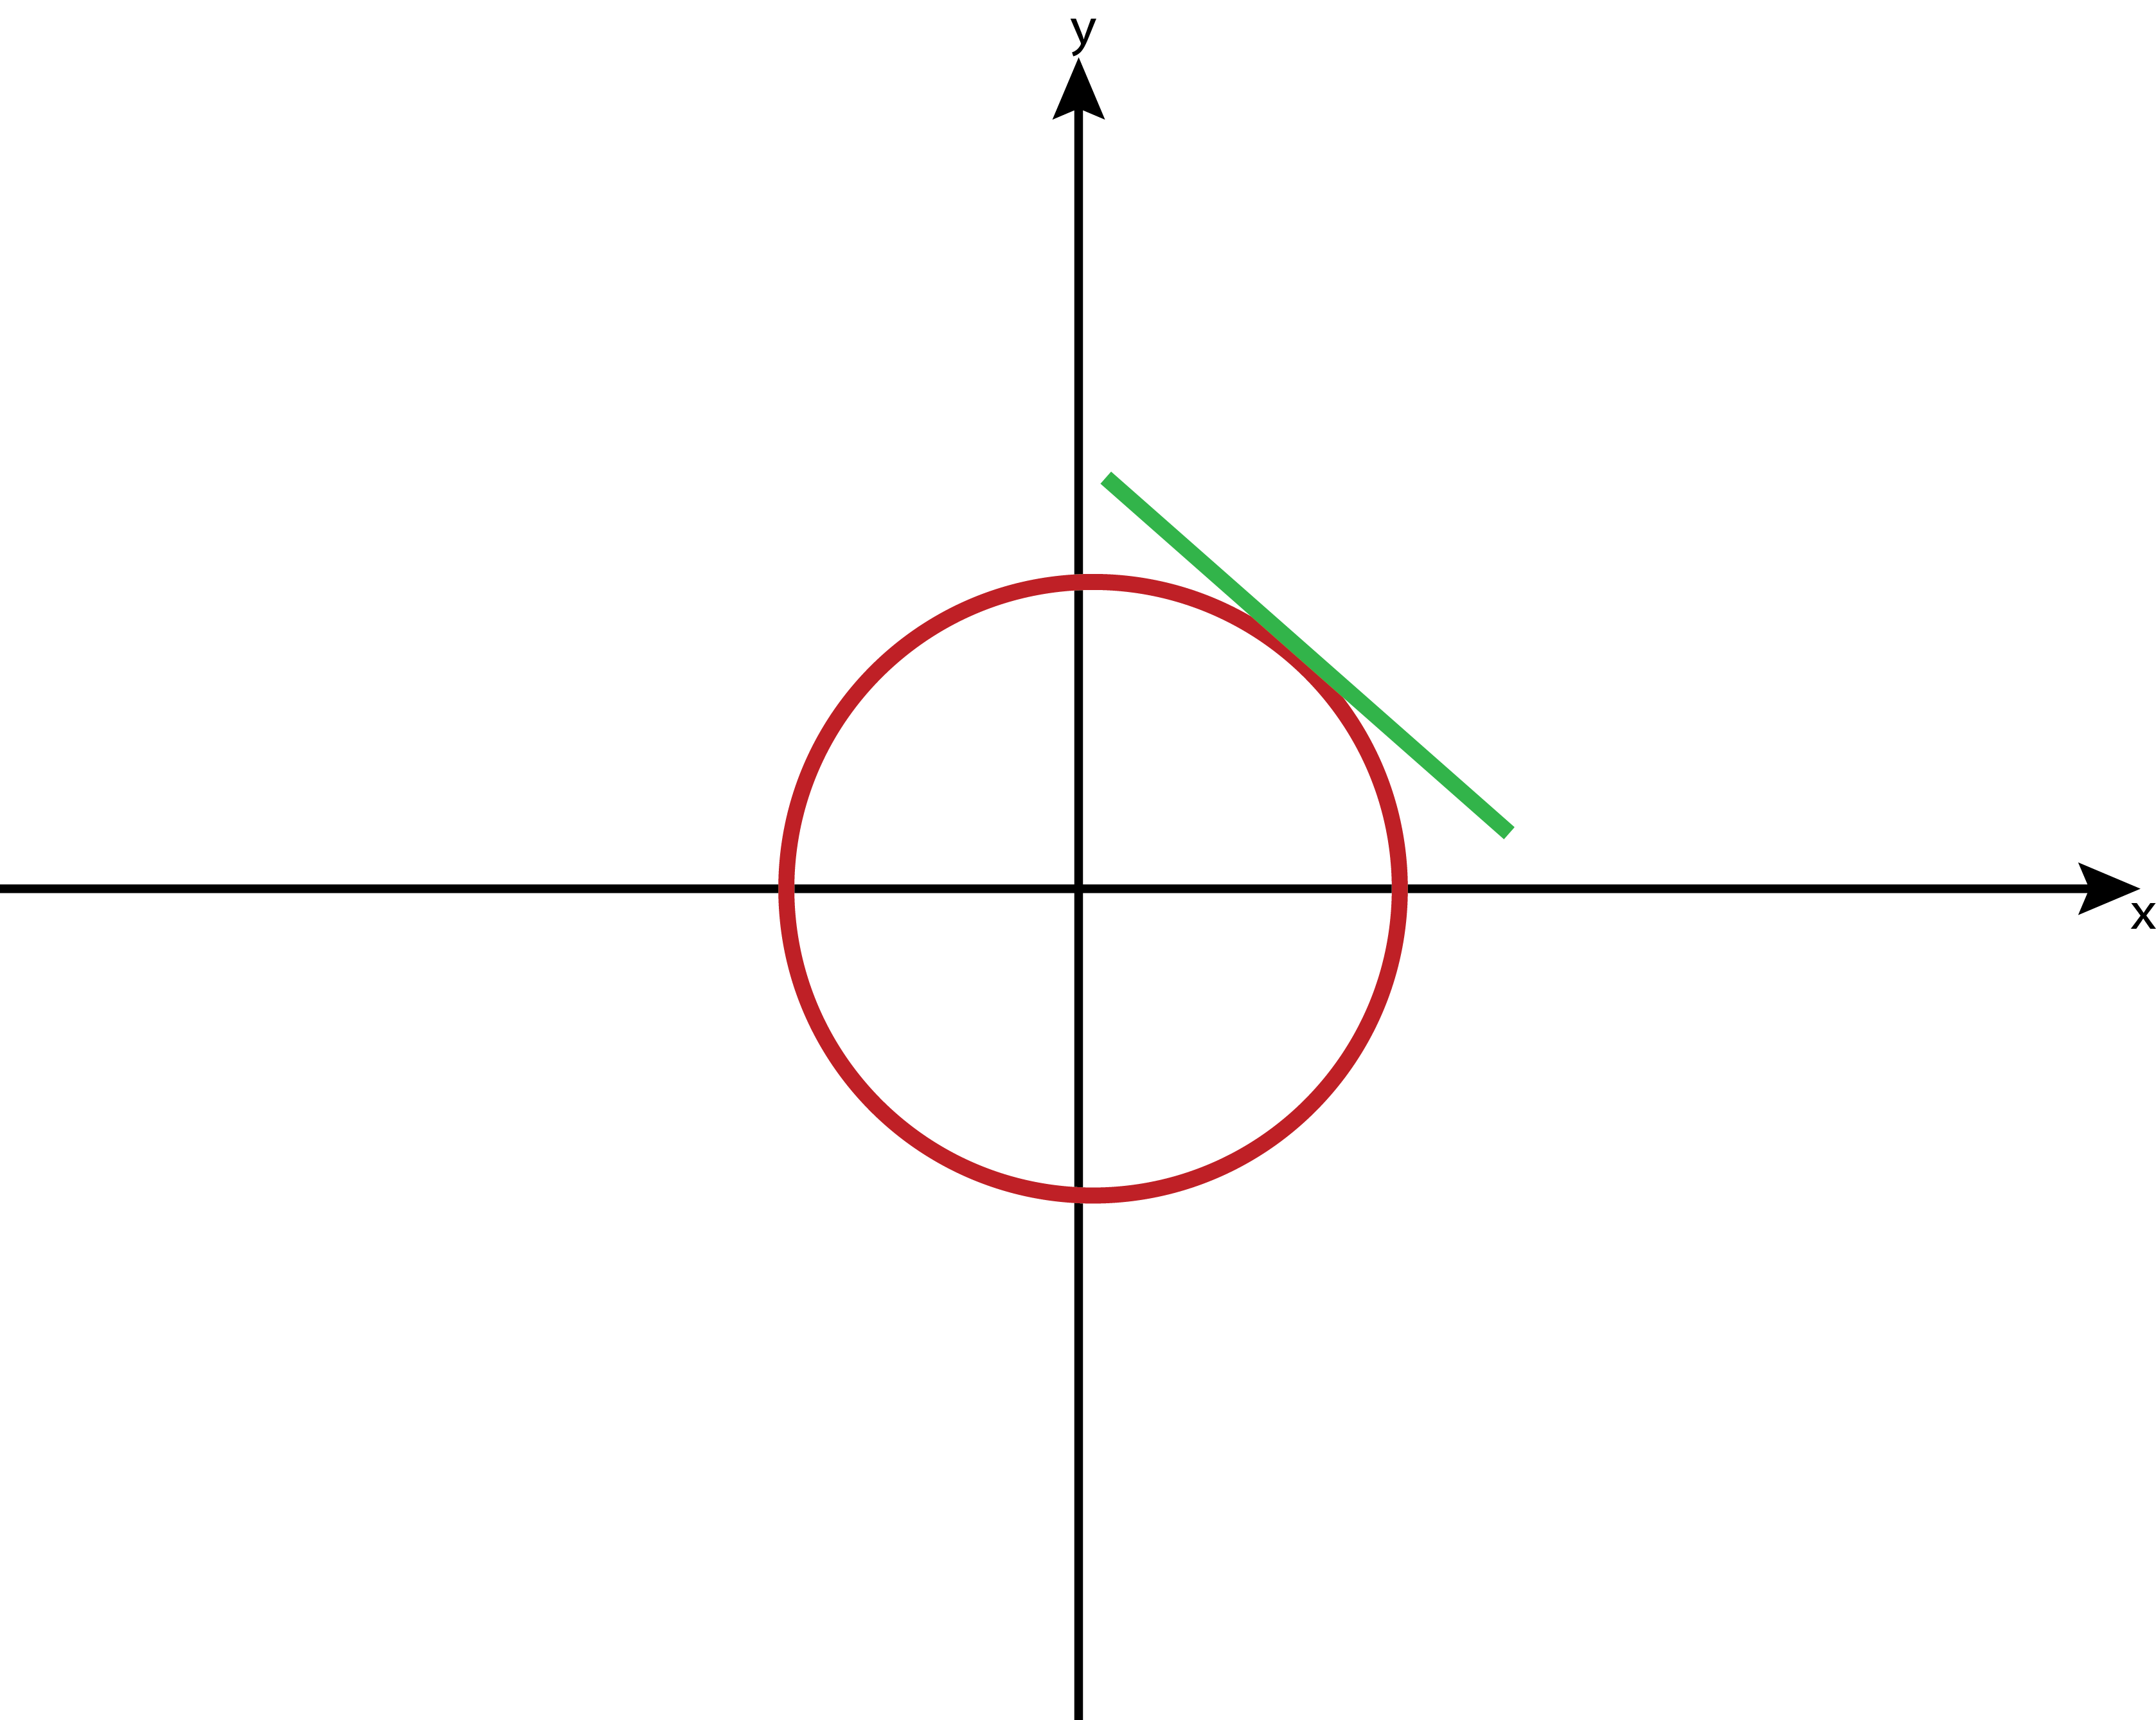
A tangent is a line which touches a curve at just one point. The circle below has a tangent drawn onto it. The slope of the tangent at any point is the same as the slope at that point. Therefore, the derivative at a point is the same as the slope of the tangent at that point.
Page 2
Example 1
Example 1: Find the equation of the line for the gradient to the curve of the function \[f(x) = 2x^2 + 4x + 3\] at the point \(x=4\)
Answer:
First find the derivative of the function, using the usual rules:
\[f'(x) = (2 \times 2)x^{2-1} + 4=4x +4\]
So now we know that the slope at any point can be found using this equation.
Therefore, the slope at the point \(x=4\) is \[f'(4) = 4(4) + 4 = 20\]
Now this is like any question about the slope of the line. We must find the y value at the point \(x=4\). \[f(x) = 2(4^2) + 4(4) + 3=32+16+3=51\]
The equation of a line that passes through the point\((x_1,y_1)\) and has slope \(m\) is found according to the formula \[y-y_1=m(x-x_1)\]
Subbing into the formula gives \[y-51=20(x-4)\] which simplifies to give \[y=20x-80+51\]\[y=20x-29\]
Page 3
Normals
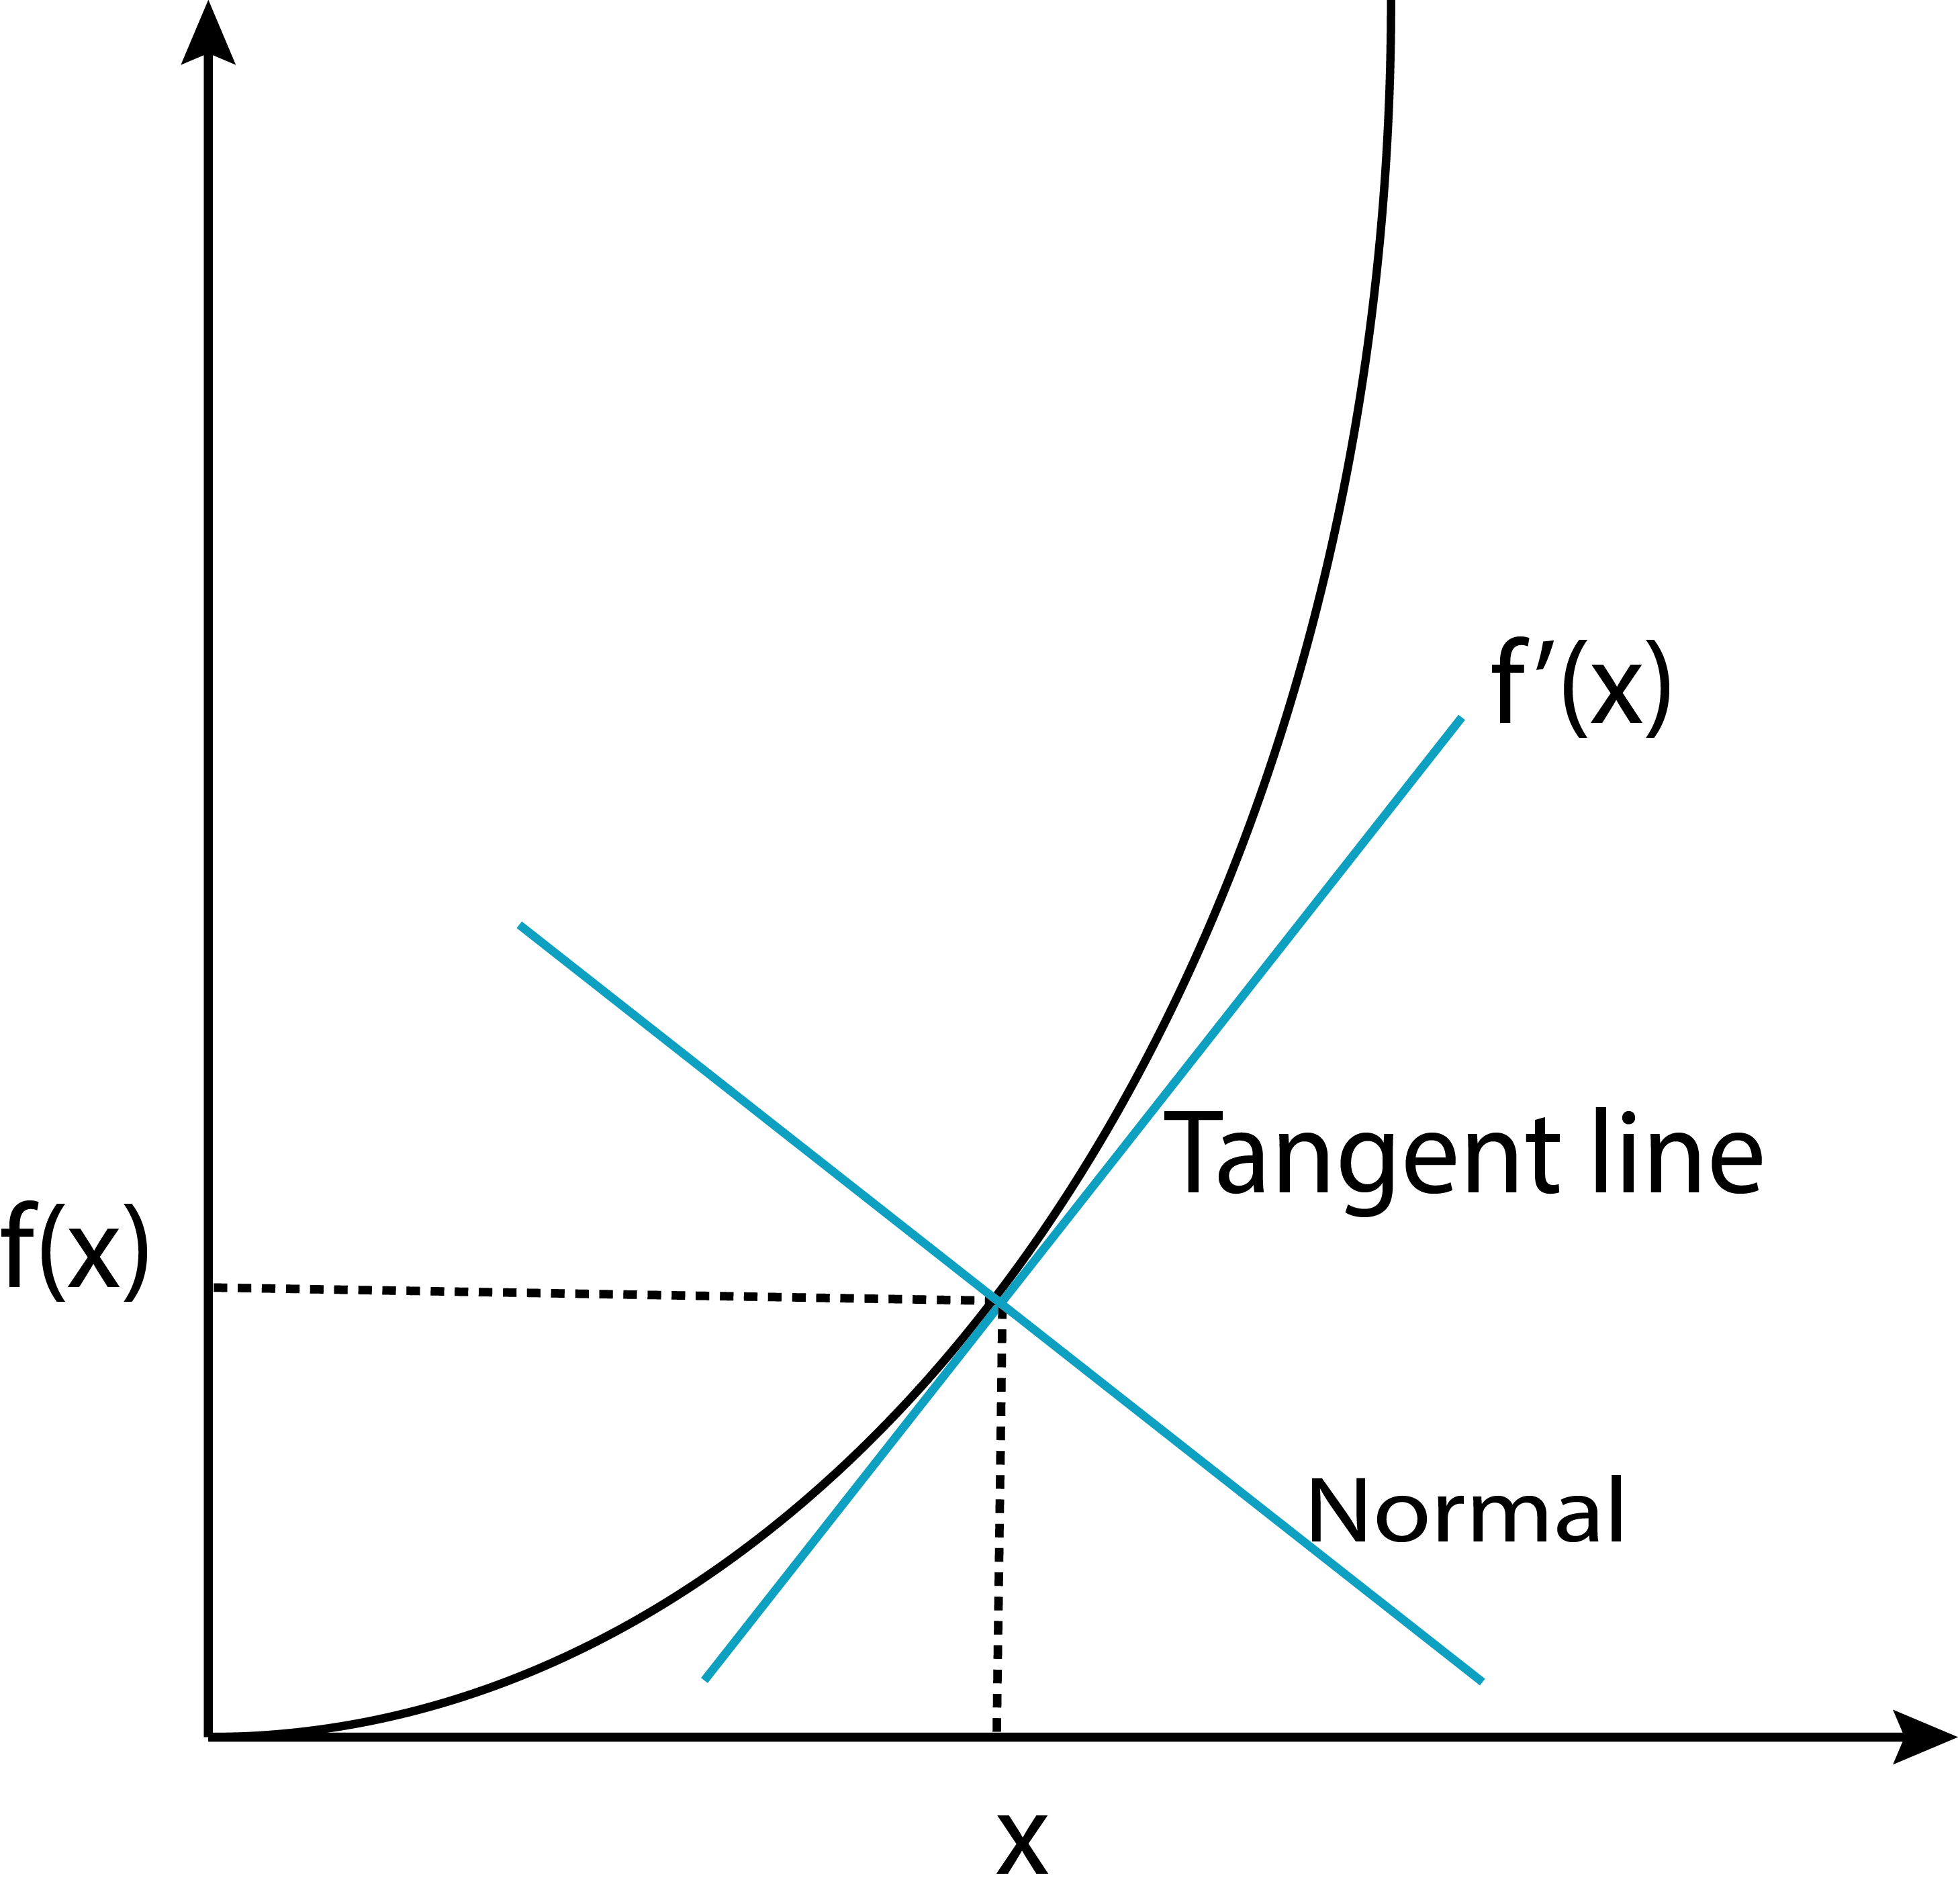
The normal to a curve at a given point is the line that is perpendicular to curve at that point.
Because the tangent to the curve has the same slope as the function at a given point, the normal will also be perpendicular to the tangent at that point.
Page 4
Example 2
Example 2:
Find the tangent to the curve \[y=x^3 + 2x^2 +3x + 6\] at the point \(x=1\).
Answer:
First find the derivative of the function: \[\frac{dy}{dx} = 3x^2 + 4x + 3\] The derivative at the point \(x=1\) can now be calculated.
\[\frac{dy}{dx} (1) = 3(1)^2 + 4(1) + 3 = 3+4+3=10\] Therefore, we know that the slope of the tangent at the point \(x=1\) is 10.
As you may know, if line 1 has a slope \(m_1\) and line 2 has a slope \(m_2\), then lines 1 and 2 are perpendicular if and only if\[m_1 \times m_2 = -1\]
So if line 1, the tangent has \(m_1 = 10\) then \[10 \times m_2 = -1\].
\[ \therefore m_2 = -\frac{1}{10}\]
Now the question continues like any other equation of the line question. First we must find the y value for the given x value. \[y(x) = x^3 + 2x^2 +3x + 6 = 1+2+3+6=12\]
So we know that the normal passes through the point \((1,12)\) and has slope \(m= -\frac{1}{10}\).
We can use the formula for the equation of the line used in the previous question to find the equation of the normal. \[y-y_1=m(x-x_1)\] \[y-12= -\frac{1}{10}(x-1)\] \[y= -\frac{1}{10}x +\frac{1}{10} +12 \]
\[y=-\frac{1}{10}x+\frac{121}{10}\]
Page 5
Maxima, minima and stationary points
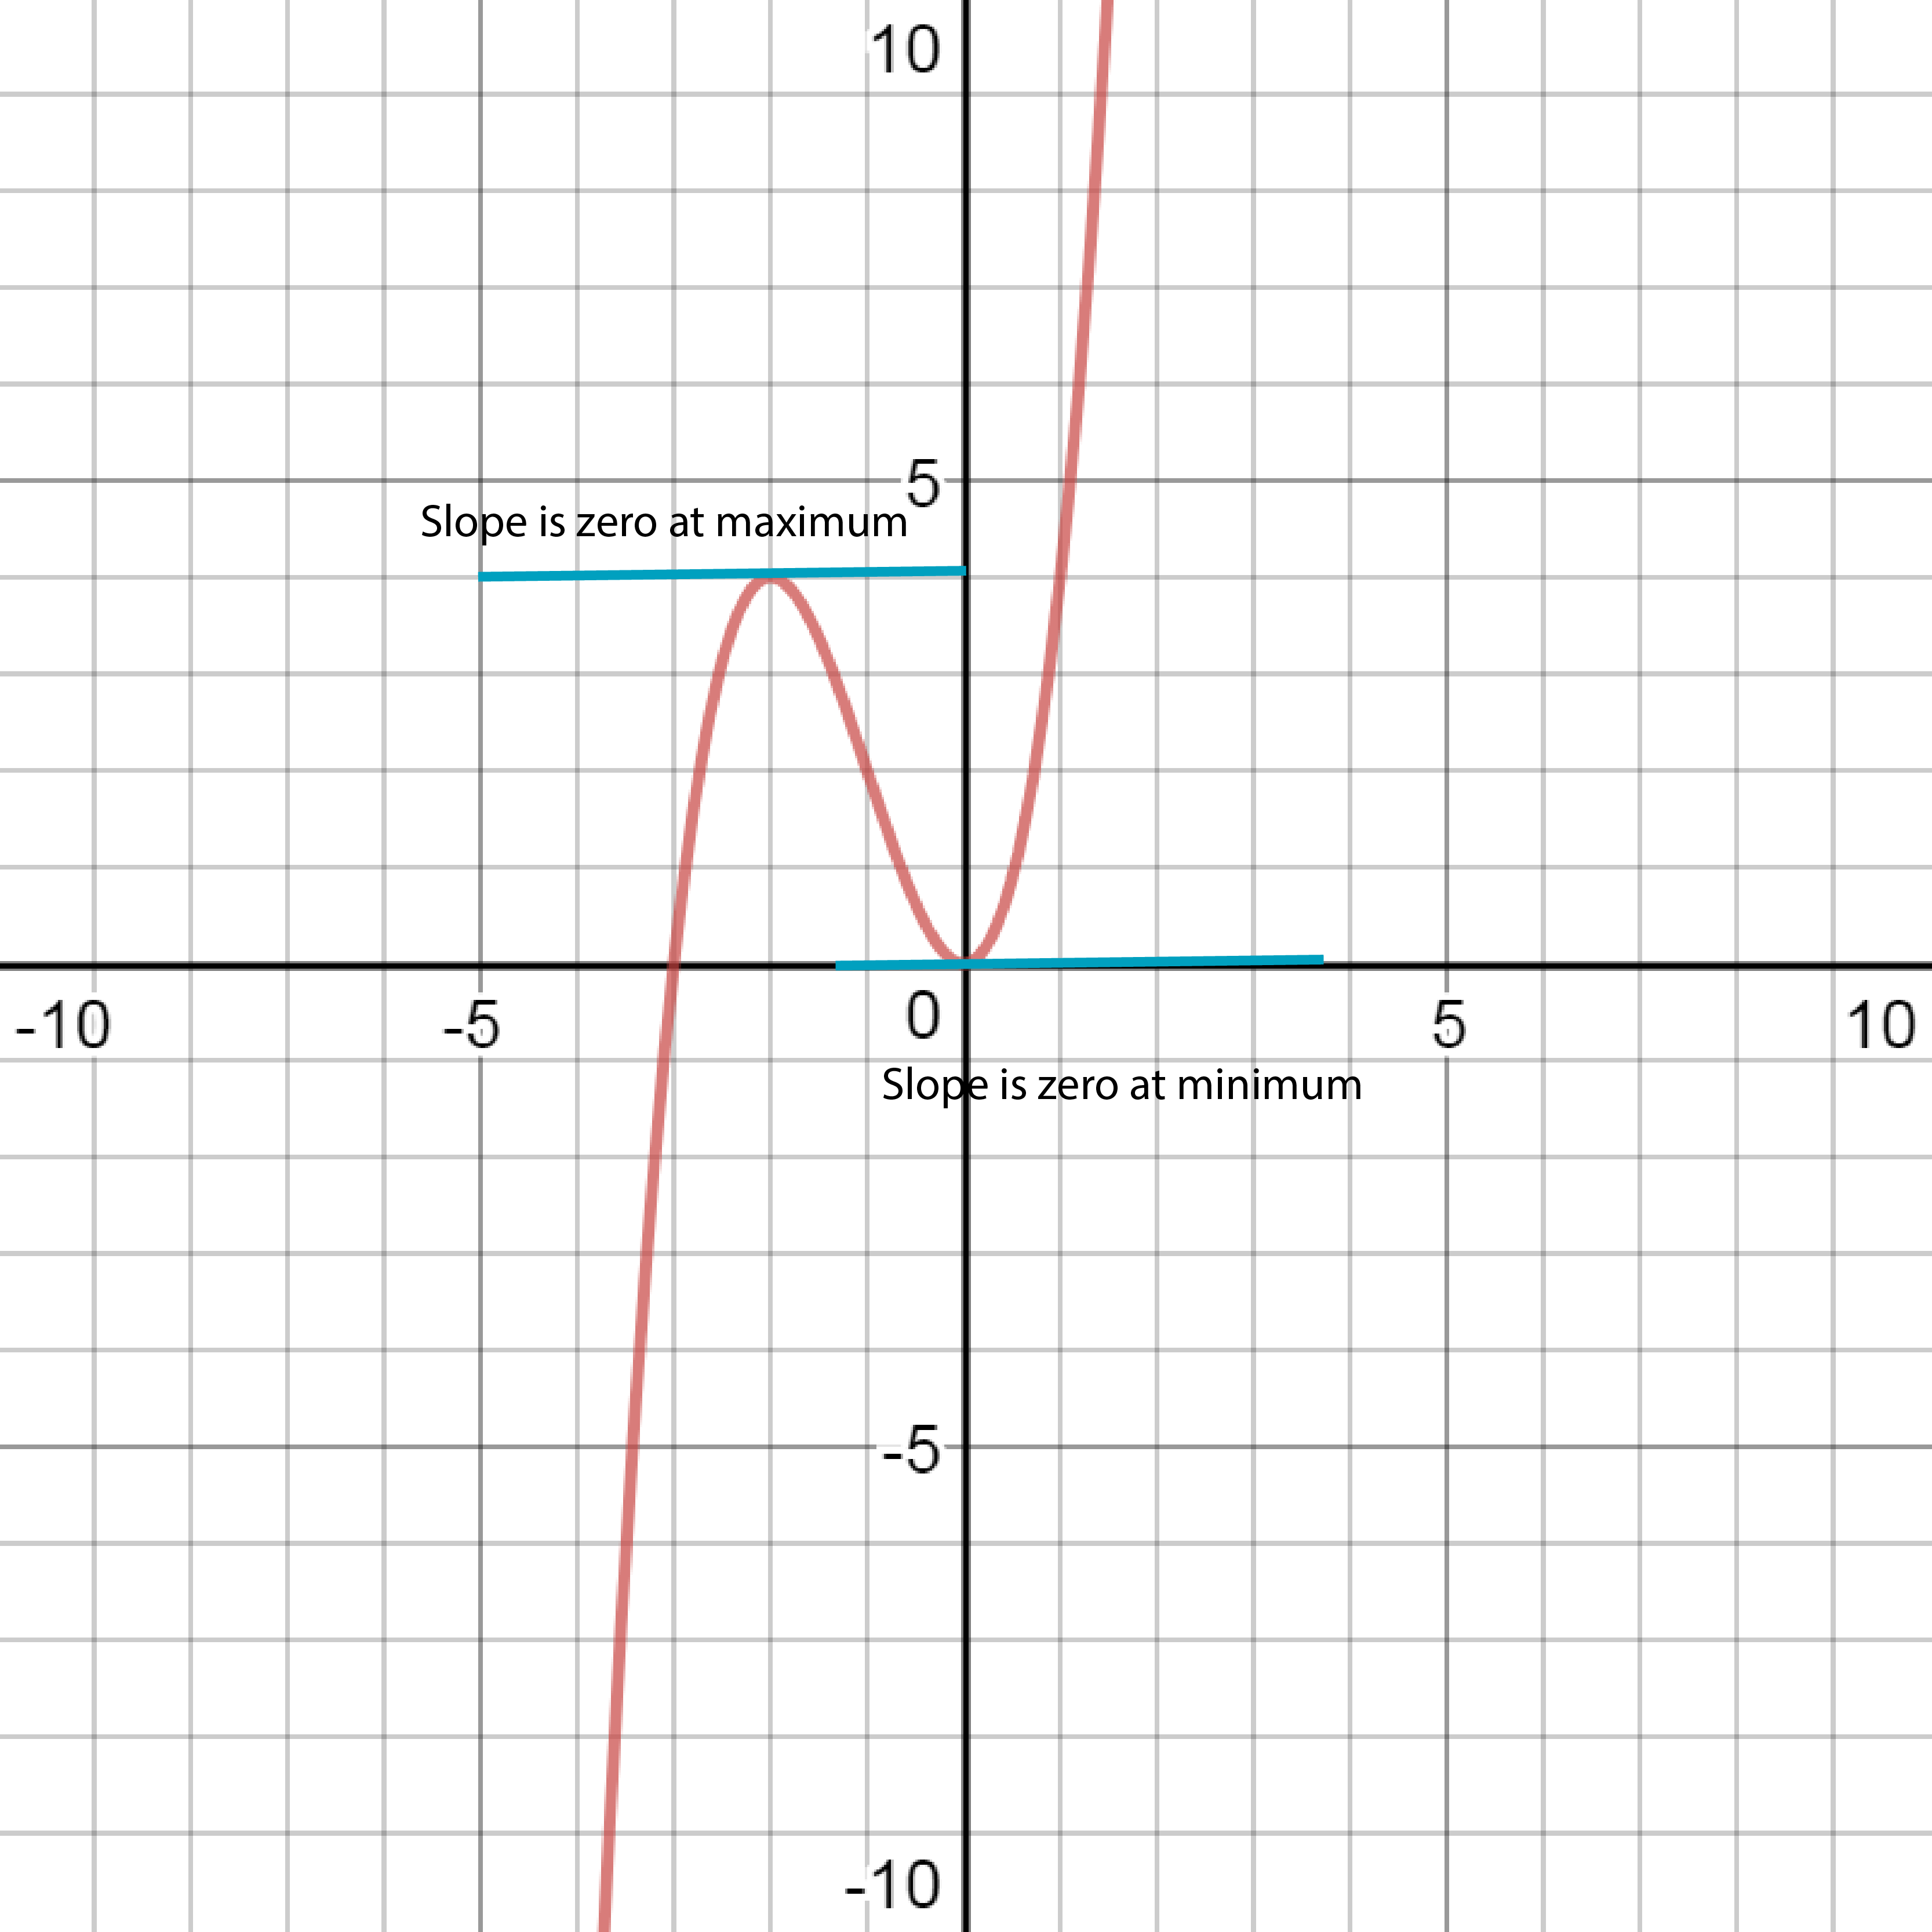
At maxima and minima, the gradient ( and hence the derivative) of the curve will be zero.
At a maximum, the second derivative will be less than zero.
At a minimum, the second derivative will be less than zero.
A point of inflection is a point at which the second derivative is equal to zero.
A function is increasing if its gradient is positive.
A function is decreasing if its gradient is negative.
Page 6
Example 3
Example 3:
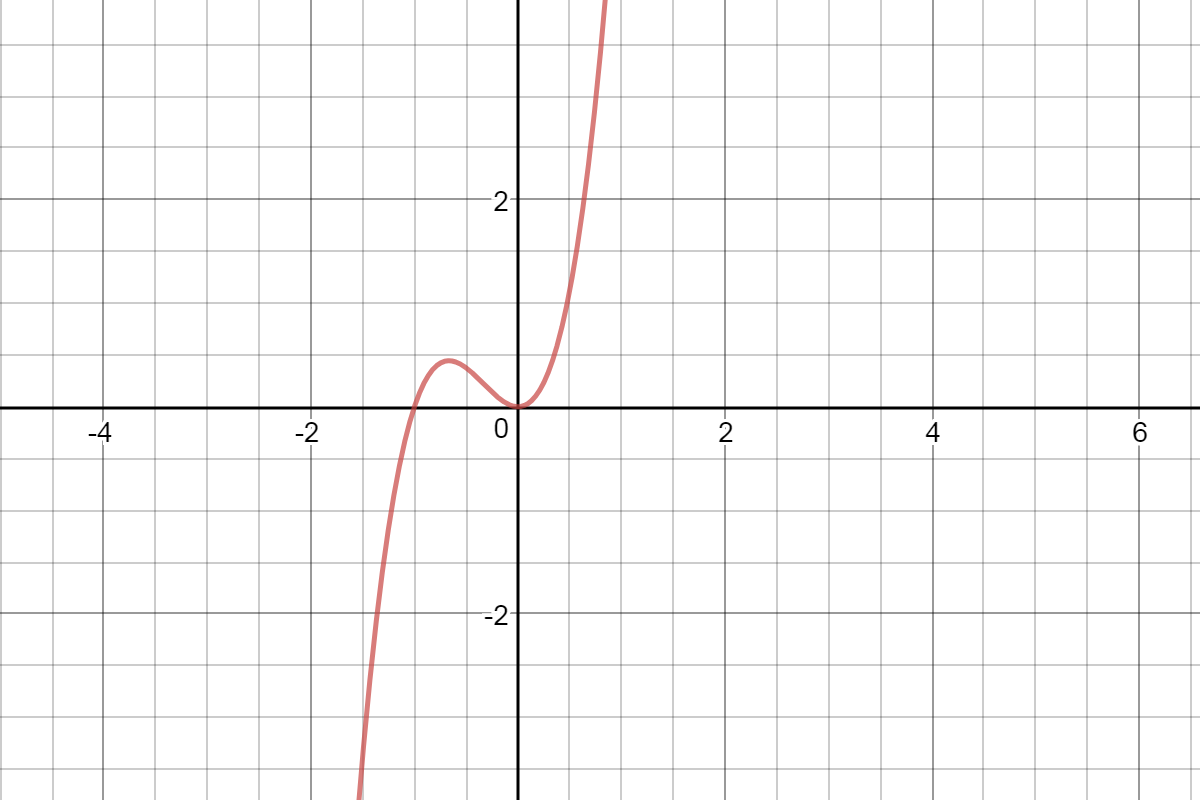
Find the maximum and minimum of the following function and then sketch it. \[f(x) = 3x^3 +3x^2\]
Answer:
First differentiate the function.
\[f'(x) =9x^2 +6x\] We know that the derivative of the function is zero at any maximum or minimum. Let \(f'(x)=0\) to find where these points are. \[f'(x)=9x^2 +6x=0\]\[3x(3x+2)=0\] \[\implies x=0 \text{ or } x=-\frac{2}{3} \]
Now we must decide whether these two points are maxima or minima or points of inflection.
This is done by finding the second derivative. \[f''(x) = 18x + 6\] Subbing in the two values for x calculated above we get \[f''(0) = 18(0) + 6=6\]\[f''(-\frac{2}{3}) = 18(-\frac{2}{3})+6=-12+6=-6\]
So this means that \(f''(x)>0 \) for \(x=0\) and \(f''(x)<0\) for \( x=-\frac{2}{3} \). Therefore, we now know that \( x=-\frac{2}{3} \) is a local maximum and \(x=0\) is a local minimum.
Finally, before we graph the function, it is necessary to factorise it and let it equal to zero in order to determine the points where it crosses the axes. \[f(x) = 3x^3 + 3x^2 = 3x^2(x+1)=0\] \[\implies x=0 \text{ or } x=-1\].
The resulting graph can be shown below.
Information
- Description
- User has deleted their subject information Note on Graphical Representations of Differentiation, created by Deleted user on 16/08/2017.
- Created by
- Deleted user · Aug 2017
- Updated
- Aug 16, 2017
- Views
- 77
- History
-
- Created by Niamh Ryan · Aug 8, 2017
- Copied by Niamh Ryan · Aug 16, 2017
- Rating