4956176
Description

Quiz by Ben Armstrong, updated more than 1 year ago
|
|
Created by Ben Armstrong
about 8 years ago
|
|
Question 1
Question
Steven scores 55% on a Mathematics exam, and 74% on an Economics exam. Which is Steven's better subject in comparison with the others in his group if the group means and SDs are 50 and 4 (Mathematics) and 70 and 8 (Economics)?
Answer
-
Economics
-
Mathematics
-
Equal in both subjects
-
There is not enough information
Question 2
Question
TR-8R scores 67% on a accuracy exam, and 38% on an stamina exam. Which is TR-8R's better attribiute in comparison with the others in his group if the group means and SDs are 55 and 8 (Accuracy) and 24 and 4 (Stamina)?
Answer
-
Stamina
-
Accuracy
-
It is impossible to tell
-
He performs equally in both
Question 3
Question
A population of scores has μ = 42. In this population, an X value of 40 corresponds to z = -0.50. What is the population standard deviation?
Answer
-
4
-
2
-
-2
-
-4
Question 4
Question
A squadron of scores has μ = 63. In this clone squadron, an X value of 54 corresponds to z = -3. What is the clone squadron's standard deviation?
Answer
-
3
-
-3
-
6
-
-6
Question 5
Question
For a population with μ = 60 and σ = 8, what is the X value corresponding to z = -0.50?
Answer
-
-4
-
56
-
64
-
59.5
Question 6
Question
For a population with μ = 78 and σ = 5, what is the X value corresponding to z = 0.8?
Answer
-
83
-
82
-
8
-
-83
Question 7
Question
A population of scores has μ = 44. In this population, an X value of 40 corresponds to z = -0.50. What is the population standard deviation?
Answer
-
6
-
2
-
4
-
8
Question 8
Question
A population of N = 5 scores has SS = 40. What is the variance for this population?
Answer
-
40/5=8
-
40/4=10
-
5(40)=200
-
4(40)=160
Question 9
Question
Under what circumstances would a score that is 15 points above the mean be considered an extreme score?
Answer
-
when the population mean is much larger than 15
-
when the population standard deviation is much larger than 15
-
when the population mean is much smaller than 15
-
when the population standard deviation is much smaller than 15
Question 10
Question
For a population with μ = 100 and σ = 20, the X value corresponding to z = 1.50 is
Answer
-
101.5
-
115
-
121.5
-
130
Question 11
Question
A population of scores has σ = 20. In this population, a score of X = 80 corresponds to z = +0.25. What is the population mean?
Answer
-
70
-
75
-
85
-
90
Question 12
Question
In N = 25 games last season, the college basketball team averaged μ = 74 points with a standard deviation of σ = 6. In their final game of the season, the team scored 90 points. Based on this information, the number of points scored in the final game was ____.
Answer
-
A little above average
-
Far above average
-
above average, but it is impossible to describe how much above average
-
There is not enough information to compare last year with the average.
Question 13
Question
What is the value of SS for the following sample?
Scores: 1, 3, 5
Answer
-
SS=8
-
SS=8/2
-
SS=8/3
-
SS=8*8
Question 14
Question
The Pearson correlation measures _____.
Answer
-
the degree of curvilinear relationship
-
the degree of relationship without regard to the form of the relationship
-
the degree of linear relationship
-
the degree to which the relationship is consistently one directional
Question 15
Question
A scatter plot shows a set of data points that are widely scattered around a line that slopes down to the right. Which of the following values would be closest to the correlation for these data?
Answer
-
-0.4
-
-0.8
-
0.4
-
0.8
Question 16
Question
A scatter plot shows a set of data points that are closely scattered around a line that slopes down to the left. Which of the following values would be closest to the correlation for these data?
Answer
-
0.7
-
-0.7
-
-0.2
-
0.2
Question 17
Question
A Pearson correlation of r = +1.00 between X and Y indicates _____.
Answer
-
Every change in X causes a change in Y
-
Each time X increases, there is a perfectly predictable increase in Y
-
All of the other 3 choices occur with a correlation of +1.00.
-
Every increase in X causes an increase in Y
Question 18
Question
A Pearson correlation of r = -1.00 between X and Y indicates _____.
Answer
-
Every change in X causes a change in Y
-
Each time X decreases, there is a perfectly predictable decrease in Y
-
All of the other 3 choices occur with a correlation of -1.00.
-
Every increase in X causes an increase in Y
Question 19
Question
Which of the following sets of correlations correctly shows the highest to lowest degree of relationship?
Answer
-
-0.91, +0.83, +0.10, -0.03
-
+0.83, +0.10, -0.91, -0.03
-
-0.91, +0.83, -0.03, -0.10
-
+0.83, +0.10, -0.03, -0.91
Question 20
Question
The Pearson correlation is calculated for a sample of n = 25 individuals. What value of df should be used to determine whether or not the correlation is significant?
Answer
-
23
-
25
-
Cannot be determined without additional information
-
24
Question 21
Question
The results of a correlation analysis are as follows: r(72) = .56, p = .046. Calculate the coefficient of determination (R2):
Answer
-
.44
-
.046
-
.56
-
.31
Question 22
Question
The results of a correlation analysis are as follows: r(123) = .75, p = .034. Calculate the coefficient of determination (R2):
Answer
-
.57
-
.56
-
.43
-
.74
Question 23
Question
When we convert a score into a score from a probability distribution, it becomes a _______.
Answer
-
Test score
-
Probability
-
Test Statistic
-
Significance Value
Question 24
Question
The p value is a conditional probability, and represents ________.
Answer
-
The probability of finding the effect if the null hypothesis was false
-
The probability of not finding the effect if the null hypothesis was true
-
The probability of finding the effect if the null hypothesis was true
Question 25
Question
A researcher conducts an experiment and discovers a non-significant (p > .05) difference between her two experimental groups. What is the next step she should take?
Answer
-
Fail to accept the alternate hypothesis
-
Reject the null hypothesis
-
Accept the alternate hypothesis
-
Fail to reject the null hypothesis
Question 26
Question
The first step in hypothesis testing is to:
Answer
-
Generate a hypothesis
-
Measure the relationship between variables
-
Decide whether to reject or fail to reject the null hypothesis
-
Calculate the p value
Question 27
Question
Which of the following is a two-tailed hypothesis?
Answer
-
We predict that the scores of Group A should be significantly higher than the scores of Group B
-
We predict a positive relationship between the scores of Group A and Group B
-
We predict that the scores of Group B should be significantly higher than the scores of Group A
-
We predict a significant difference between the scores of Group A and Group B
Question 28
Question
Which of the following is an example of a null hypothesis?
Answer
-
The scores of Group A will correlate with the scores of Group B
-
The scores of Group A will be greater than the scores of Group B
-
The scores of Group A and Group B will not differ significantly
-
The scores of Group A and Group B will differ significantly
Question 29
Question
Which of the following is the most appropriate description of a Type I error?
Answer
-
Fail to reject the null hypothesis when it is false
-
Fail to reject the null hypothesis when it is true
-
Reject the null hypothesis when it is true
-
Reject the null hypothesis when it is false
Question 30
Question
Which of the following is the most appropriate description of a Type II error?
Answer
-
Fail to reject the null hypothesis when it is true
-
Reject the null hypothesis when it is false
-
Fail to reject the null hypothesis when it is false
-
Reject the null hypothesis when it is true
Question 31
Question
A researcher conducts an experiment and discovers a significant (p < .05) difference between her two experimental groups. What is the next step she should take?
Answer
-
Reject the null hypothesis
-
Fail to reject the null hypothesis
-
Accept the alternate hypothesis
-
Fail to accept the alternate hypothesis
Question 32
Question
A researcher decides to run a correlation to discover whether a positive relationship exists between variable X and variable Y. He should conduct a _____.
Answer
-
2 tailed test
-
1 tailed test
-
Type II test
-
Type I test
Question 33
Question
An independent-measures t hypothesis test is appropriate when ____.
Answer
-
the mean for a treated group of subjects is compared to a known population mean
-
there are two separate samples containing different subjects
-
the value for s is known
-
one sample is used to test a hypothesis about one population
Question 34
Question
Which of the following research situations is most likely to use an independent-measures design?
Answer
-
Evaluate the difference in verbal skills between 3-year-old girls and 3-year-old boys.
-
Evaluate the effectiveness of a diet program by measuring how much weight is lost during 4 weeks of dieting.
-
Evaluate the effectiveness of a cholesterol medication by comparing cholesterol levels before and after the medication.
-
Evaluate the development of verbal skills between age 2 and age 3 for a sample of girls.
Question 35
Question
A researcher reports t(24) = 5.30 for an independent-measures experiment. How many individuals participated in the entire experiment?
Answer
-
25
-
12
-
26
-
24
Question 36
Question
An independent-measures experiment uses one sample with n = 10 and a second sample with n = 15 to compare two experimental treatments. The t statistic from this experiment will have degrees of freedom equal to ____.
Answer
-
23
-
24
-
25
-
26
Question 37
Question
The results of an independent-measures research study are reported as "t(5) = -2.12, p = .67, two tails." What statistical decision was made?
Answer
-
There was a marginally significant effect.
-
The researcher failed to reject H0.
-
The null hypothesis was rejected.
-
Cannot be determined from the researcher's statement
Question 38
Question
Which of the following is a parametric test?
Answer
-
Wilcoxon
-
Mann-Whitney
-
Spearman's RHO
-
Pearson's r
Question 39
Question
Which is NOT an assumption underlying Parametric tests?
Answer
-
At least interval level data
-
Normally Distributed
-
Doesn't meet the homogeneity of variance
-
No extreme scores
Question 40
Question
What is the Pearson r in this correlation?
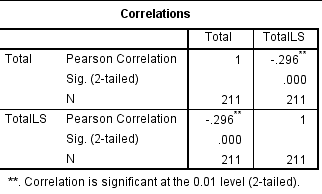
Answer
-
-.296
-
211
-
.000
-
1
Question 41
Question
What is the P value in this Pearson correlation?
Answer
-
P=.000
-
P<.001
-
P>.001
-
P=-.291
Question 42
Answer
-
211
-
1
-
.000
-
-.291
Question 43
Question
What is the P value and can we reject the null hypothesis?
Answer
-
.993, no
-
.993, yes
-
.987, no
-
.000, yes
Question 44
Question
There is a _______ % chance of the results being obtained by sampling error alone
Answer
-
99%
-
-0.1%
-
-.009%
-
98%
Question 45
Question
What does reliability mean?
Answer
-
Used to measure the degree to which something measures what it is supposed to and whether the cause and effect can be understood
-
Used to measure the degree of which measurements are consistent or repeatable and whether the experiment yields similar reults
-
Should yield similar results irrespective of who administers it
-
Face, content, concurrent etc
Question 46
Question
What does validity mean?
Answer
-
To what degree are measurements consistent and repeatable
-
To what degree the experiment measures what it is supposed to
-
To what degree findings are similar irrespective of who administers them
-
Includes internal consistency measures e.g. split half, odd-even etc
Question 47
Question
Which is NOT a method of assessing reliability?
Answer
-
Cronbach's Alpha
-
Test-retest
-
Inter-rater
-
Known groups
Question 48
Question
What is the correct order for hypothesis testing?
Answer
-
Generate a hypothesis, Conduct a study, Work out probability, Decide to reject or accept the null hypothesis
-
Conduct a study, Generate a hypothesis, Work out probability, Decide to reject or accept the null hypothesis
-
Work out probability, Generate a hypothesis, Decide to reject or accept the null hypothesis, Conduct a study
-
Decide to reject or accept the null hypothesis, Conduct a study, Work out probability, Generate a hypothesis
Question 49
Question
What is the critical region in relation to a normal distribution?
Answer
-
The middle 95%
-
The 5% underneath the tails
-
The whole curve
-
There isn't a critical region
Question 50
Question
What is the SS of the following numbers? 5,7,1,4
Answer
-
18.74
-
-36.745
-
36.75
-
10.5
Question 51
Question
Chocolate will positively correlate with happiness. What type of directional hypothesis is this?
Answer
-
One-tailed
-
Two-Tailed
-
Type I
-
Type II
Question 52
Question
In a set of data with extreme scores what would be the best measure of central tendency?
Answer
-
Mean
-
Median
-
Mode
-
Range
Question 53
Question
Repeated measures, normally distributed, Violation of homogeneity of variance. What statistical test should be used?
Answer
-
Wilcoxon
-
Mann-Whitney
-
Pearson's r
-
Chi-Square
Question 54
Question
Independent groups, Normally distributed, Violation of homogeneity of variance. What statistical test should be used?
Answer
-
WIlcoxon
-
Chi-square
-
Mann-Whitney
-
Spearman's RHO
Question 55
Question
The standard error is...
Answer
-
The standard deviation divided by the square root of the number of participants in the sample
-
The square root of variance
-
A point estimate
-
N squared
Question 56
Question
What is t when the sample mean is 36 and the population mean in 57 and a standard error of 5.6?
Answer
-
-3.75
-
3.75
-
4.28
-
-4.28
Question 57
Question
In relation to Cohen's d what are the effect sizes?
Answer
-
0.2=small, 0.5=moderate, 0.8=large
-
0.2=large, 0.5=moderate, 0.8=small
-
0.3=small, 0.6=moderate, 0.9=large
-
0.3=large, 0.6=moderate, 0.9=small
Question 58
Question
If two variables are totally independent, then the correlation between them is:
Answer
-
-0.1
-
-1
-
1
-
zero
Question 59
Question
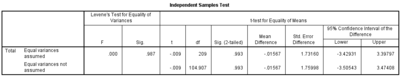
In an independent t-test, you would use the equal variances are not assumed part of the output when Levene's test is
Answer
-
Above a criterion significance level (e.g. p>0.05)
-
Below a criterion significance level (e.g. p<0.05)
-
When number of participants are unequal in the two conditions
-
When you have skewed data
Question 60
Question
Levene's test is:
Answer
-
A test of heterogeneity that relies on the assumption of abnormality
-
A test of homogeneity that relies on the assumption of abnormality
-
A test of heterogeneity that does not rely on the assumption of normality
-
A test of homogeneity of variances that does not rely on the assumption of normality
Question 61
Question
We can't use a single t-test to compare:
Answer
-
1 group to a population (one;sample t;test)
-
2 groups to each other (independent;samples t;test)
-
Scores on 2 measures to each other (paired;samples t;test)
-
More than two groups
Question 62
Question
How many t-test comparisons would you need to conduct as follow ups, if there are 8 levels in the factor?
Answer
-
21
-
25
-
28
-
35
Question 63
Question
What is the main problem with using multiple t-tests?
Answer
-
Increased chances of a type one error (reject the null hypothesis when it is true) as each comparison increases p-value
-
Increased chances of a type two error (failing to reject the null hypothesis when it is false) as each comparison decreases p-value
-
There isn't one
Question 64
Question
The narrower the confidence intervals:
Answer
-
The more confidence you can place in your results
-
The less you can rely on the results
-
The greater the chance that your results were due to sampling error
Question 65
Question
Repeated measures designs are:
Answer
-
Are exactly the same power as independent design
-
Less powerful than independent designs
-
More powerful than independent designs
-
None of the above
Question 66
Question
Sample means are:
Answer
-
Point estimates of sample means
-
Interval estimates of population means
-
Interval estimates of sample means
-
Point estimates of population means
Question 67
Question
For an experiment comparing two treatment conditions, an independent-measures design would obtain ____ score(s) for each subject and a repeated-measures design would obtain ____ score(s) for each subject.
Answer
-
1, 2
-
2, 1
-
2, 2
-
1, 1
Question 68
Question
A repeated-measures study finds a mean difference of MD = 5 points between two treatment conditions. Which of the following sample characteristics is most likely to produce a significant t statistic for the hypothesis test?
Answer
-
A small sample size (n) and a large variance
-
A small sample size (n) and a small variance
-
A large sample size (n) and a small variance
-
A large sample size (n) and a large variance
Question 69
Question
For which of the following situations would a repeated-measures research design be appropriate?
Answer
-
Comparing problem solving skills for science majors versus art majors at a college
-
Comparing self-esteem for students who participate in school athletics versus those who do not
-
Comparing pain tolerance before and after taking a new pain medication
-
Comparing verbal skills for girls versus boys at age 3
Question 70
Question
A research report describing the results from a repeated-measures study includes the following: "The data show no significant difference between the two treatments, t(10) = 1.65, p = .07." Based on this report, you can conclude that a total of ____ individuals participated in the research study .
Answer
-
10
-
11
-
12
-
9
Question 71
Question
For the repeated-measures t statistic, df = ____.
Answer
-
(n1 - 1) + (n2 - 1)
-
n1 + n2 - 2
-
n - 1
-
n1 + n2 - 1
Question 72
Question
A repeated-measures experiment and a matched-subjects experiment both produce t statistics with df = 20. Which experiment used more subjects?
Answer
-
They both used n = 22 subjects
-
Repeated measures
-
They both used n = 21 subjects.
-
Matched subjects
Question 73
Question
Which of the following sets of data is most likely to produce a significant t statistic? NB: MD = Mean Difference, SS = Sum of Squared Deviations
Answer
-
MD = 2 and SS = 10
-
MD = 2 and SS = 100
-
MD = 10 and SS = 10
-
MD = 10 and SS = 100
Question 74
Question
If the null hypothesis is true, on average the expected value for the related-samples t statistic is ____.
Answer
-
1
-
1.96
-
t > 1.96
-
0
Question 75
Question
A research report describing the results from a repeated-measures study states, "The data showed a significant difference between treatments, t(22) = 4.71, p < .001." From this report you can conclude that the outcome of the hypothesis test was ____.
Answer
-
To reject the null hypothesis
-
To fail to reject the null hypothesis
-
To make a Type II error
-
To make a Type I error
Question 76
Question
The purpose for post tests is
Answer
-
To determine whether or not a Type I error was committed.
-
To determine how much difference exists between the treatments.
-
To determine which treatments are significantly different.
-
None of the above.
Question 77
Question
In general, the largest F-ratio will be obtained when the differences between sample means are ____ and the magnitudes of the sample variances are ____.
Answer
-
Small, small
-
Small, large
-
Large, small
-
Large, large
Question 78
Question
In analysis of variance, the F-ratio is a ratio of?
Answer
-
Sample means
-
Sample means divided by variances
-
Variances
-
Sample variances divided by sample means
Question 79
Question
In analysis of variance, the term factor refers to ____.
Answer
-
A dependent variable
-
An independent (or quasi-independent) variable
-
A treatment mean
-
A treatment total
Question 80
Question
When the null hypothesis is true for an ANOVA, what is the expected value for the F-ratio?
Answer
-
0
-
1.00
-
k - 1
-
N - k
Question 81
Question
For an experiment comparing more than two treatment conditions you should use analysis of variance rather than separate t tests because ____.
Answer
-
You are less likely to make a mistake in the computations of ANOVA
-
A test based on variances is more sensitive than a test based on means
-
ANOVA has less risk of a Type I Error because several means are compared in one test
-
ANOVA has less risk of a Type II Error because several means are compared in one test
Question 82
Question
Under what circumstances is the experimentwise alpha level a concern?
Answer
-
Whenever you do an analysis of variance
-
Whenever an experiment compares exactly two treatments
-
Whenever an experiment involves more than one hypothesis test
-
Whenever the alpha level is greater than .05
Question 83
Question
How many levels did the independent variable have?
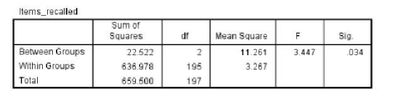
Answer
-
2
-
1
-
3
-
4
Question 84
Question
Which of the following statistical statements best describes the result of the analysis:
Answer
-
F(2,197) = 3.45, p = .034
-
F(2,197) = 3.45, p = 0.034
-
F(2,195) = 3.45, p = 0.034
-
F(2,195) = 3.45, p = .034
Question 85
Question
How many participants were included in this analysis?
Answer
-
195
-
197
-
198
-
194
Question 86
Question
A study finds a correlation coefficient of 0.5, what amount of variance is left unexplained?
Answer
-
50%
-
75%
-
40%
-
64%
Question 87
Question
A study finds an effect size of 64%, what is the value of Pearson's r?
Answer
-
0.64
-
0.36
-
0.8
-
36%
Question 88
Question
What is the basis or logic of inferential statistical tests?
Answer
-
To work out the probability of obtaining an effect due to sampling error when the null hypothesis is true
-
To work out the probability of obtaining an effect due to sampling error when the null hypothesis is false
-
To work out the probability of making a type II error
-
All of the answers
Question 89
Question
Power of an experiment is:
Answer
-
α
-
The ability of the experiment to reject the null hypothesis if it is, in fact, false
-
The sensitivity of participants to your experimental manipulation
-
All of the answers
Question 90
Question
How do we denote power?
Answer
-
α
-
1 - α
-
β
-
1 - β
Question 91
Question
Quasi-experimental designs have?
Answer
-
Non-random allocation of participants to conditions
-
An IV and a DV
-
No IV or DV
-
Both an IV and a DV as well as non-random allocation of participants in conditions
Question 92
Question
The higher the t-value, the more likely it is that the differences between groups are:
Answer
-
A result of sampling error
-
Not a result of sampling error
-
Similar to each other
-
None of the answers
Question 93
Question
The effect size for independent groups, d, can be calculated by:
Answer
-
(Mean 1 - Mean 2) / mean SD
-
(Mean 1 + Mean 2) / mean SD
-
(Mean 1 - Mean 2) / SEM
-
(Mean 1 + Mean 2) / SEM
Question 94
Question
Power is the ability to detect:
Answer
-
A statistically significant effect where one exists
-
A psychologically important effect where one exists
-
Both Statistically and Psychologically important
-
Design flaws
Question 95
Question
A researcher has found a correlation coefficient of r=+.3, CI(95%) = -.2 - (+.7). Which is the most sensible conclusion? We are 95% confident that the population regression line would be:
Answer
-
Positive (+.3)
-
Zero
-
Negative (-.2)
-
Between -.2 and +.7
Question 96
Question
When the between-groups variance is a lot larger than the within-groups variance, the F-value is _____ and the likelihood of such a result occurring by sampling error ____.
Answer
-
Large;Increases
-
Large;Decreases
-
Small;Increases
-
Small;Decreases
Want to create your own Quizzes for free with GoConqr? Learn more.