
Flashcards
1.3 Muhammad Ali Imran
Cards in this deck (20)
- 1what does discrete mean?grouping such as animals-cat, dog, monkey.
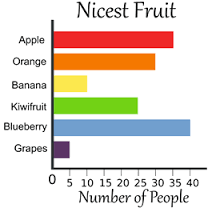
- 2what are bar and Column graphs used for?set of observations that are discrete.
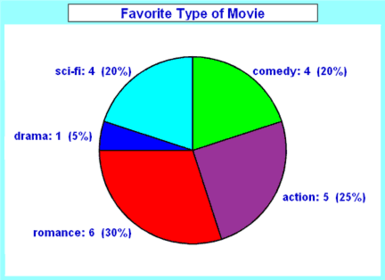
- 3what is another word for pie graph?another word would be sector graph.
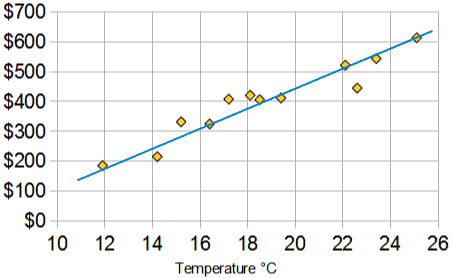
- 4what is a line of best fit graph?instead of connecting all the dots the line just goes through the middle of them all.
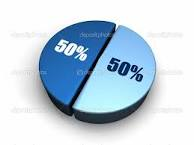
- 5what percent of a pie graph would half be?50 percent
- 6what's a hypothesis?An educated guess.

- 7what does continuous mean?if you choose two numbers there will be a number I between them.
- 8what graph would be used to tell the percentage of your class mates born overseas?a pie or sector graph would be the best option.
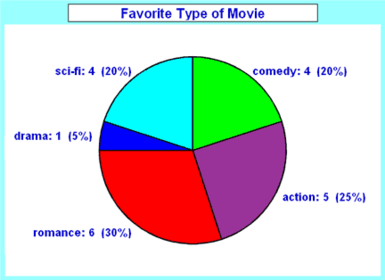
- 9why would scientists read what other scientists have found out in their experiments?to see if their experiment comes to the same conclusion.

- 10how is a hypothesis different from a guess?a hypothesis is an educated guess.
- 11what would be the best graph to record the weather?a line graph or line of best fit graph would be the best.
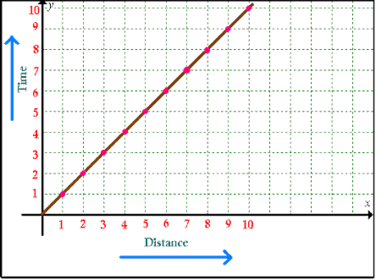
- 12what must a pie graph percent add up to?it must add up to 100 percent.
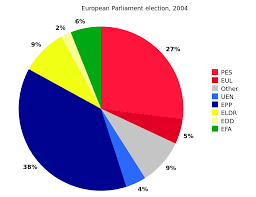
- 13why should a scientist record his findings?so that he can share with others about his finding as it could be something that can change humanity.
- 14what is a procedure?an explanation of what you did in the experiment step by step and in chronilogical order.
- 15what is a review?a short summery of what you found out in the experiment.
- 16what is a good program in which scientists can write down their results?Microsoft excel is a good program.

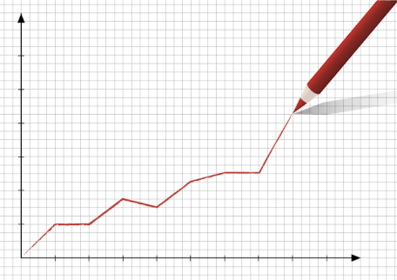
- 17what is a graph?a graph shows information a lot clearer than in tables.
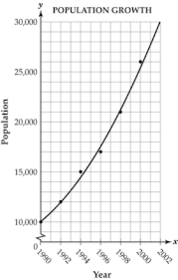
- 18what is a curve of best fit?a curve connecting all the dots instead of lines.
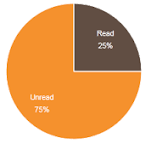
- 19what does a quarter of a pie graph represent?25 percent
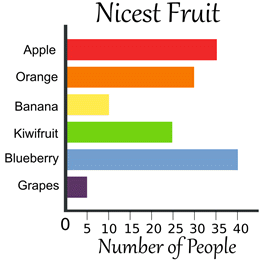
- 20which way does a bar graph go?a bar graph goes horizontal.
Information
- Description
- Flashcards on 1.3 Muhammad Ali Imran, created by Muhammad Imran on 13/02/2017.
- Created by
- Muhammad Imran
- Views
- 15
- Rating