
Data Representation and Frequency Distributions mind maps
32 mind maps by 30 users
This GoConqr page gathers mind maps on data collection, graphs and frequency distributions. School students, university students and primary pupils can practise data handling, while teachers can find material for lessons. The collection spans primary to university level and includes over 20 mind maps. Choose a map to begin.
Mind maps
-
Which visual representation do I use?
-
Chapter 6
-
Statistics
-
Visualizations
-
Data presentation-cartographic
-
Untitled
-
the data handling cycle
-
Data Handling Cycle
-
organizing data in tables
-
Graphical techniques
-
Types of data
-
Maths
-
VISUAL - FREQ DISTR of Quantative
-
Charts, Facts and Statistics
-
Time plot and plot patterns
-
Time plots and time series patterns
-
Description of Data and Graphs
-
DATA
-
Dot plots
-
Collecting data
-
Handling Data
-
Data Collection
-
Math (Unit 5)
-
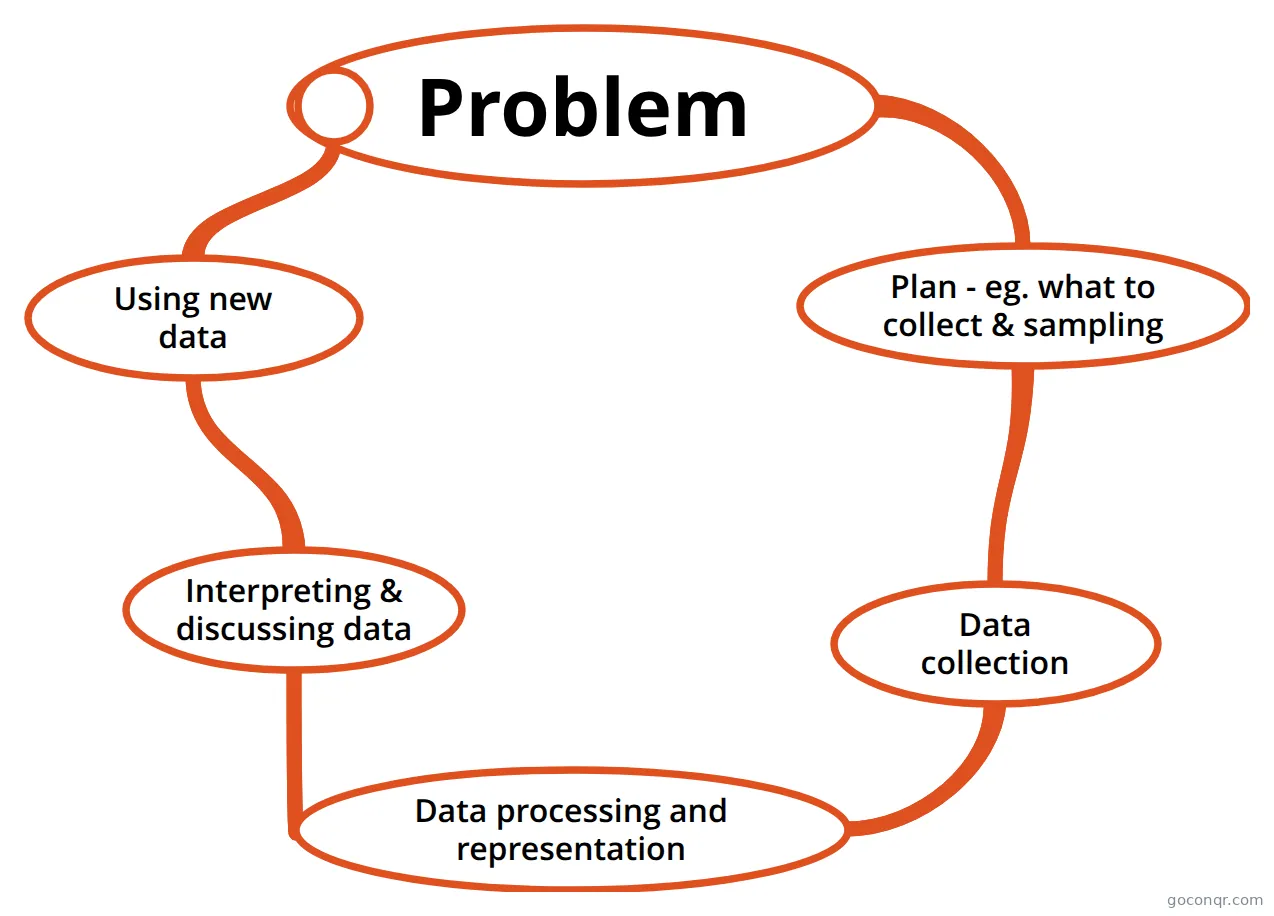 Problem Data cycle for Data Handling course
-
Graphs
-
Graphing
-
STATISTICS
-
Statistics
-
Graphs
-
Graphing
-
DATA ORGANIZATION AND PRESENTATION
-
data collection
More Data Representation and Frequency Distributions resources
About data representation and frequency distributions mind maps
GoConqr OriginalData Representation and Frequency Distributions mind maps
These maps connect ideas through branches, making it easier to follow a topic at a glance. Graphing brings together bar, line and pie graphs with features such as axes, labels and scale. Graphical techniques links histograms to frequencies grouped in classes.
For a starting point, use Graphing to review the parts of a graph. Then look at Visualizations for categorical data, contingency tables and bar graphs. The map on choosing a visual representation also links types of data to charts.
Revise with a map
Follow one branch at a time, then cover the map and recall the connections. Return to a branch if you miss a term or graph feature. When you want to test your understanding, switch to a quiz on the unit page; use flashcards when you want to review terms. Open a map and follow a branch that interests you.
Frequently asked questions
Which mind map could I start with?
Start with Graphing if you want to review graph types and their features. It brings together bar, line and pie graphs with axes, labels, titles and scale. For data collection instead, Collecting data covers surveys, observation, experiments and questionnaire design.
What do the mind maps cover?
The maps cover collecting and organising data, graph features and ways to display data. Visualizations includes categorical data, contingency tables and bar graphs. Graphical techniques covers histograms and frequencies in classes, while the map on cartographic data presentation includes dot maps and choropleth maps.
Are these mind maps free to use?
Yes. Every mind map listed here is free to open and study without an account. A free account also lets you save quiz scores and make your own quizzes, mind maps, flashcards and notes. The listed resources were made by GoConqr users.