Bar graphs

Descripción

School supplies represented on a bar graph.
disha Manchanda
Fichas por disha Manchanda, actualizado hace más de 1 año
disha Manchanda
Creado por disha Manchanda hace casi 3 años
0
0

Resumen del Recurso

Pregunta Respuesta
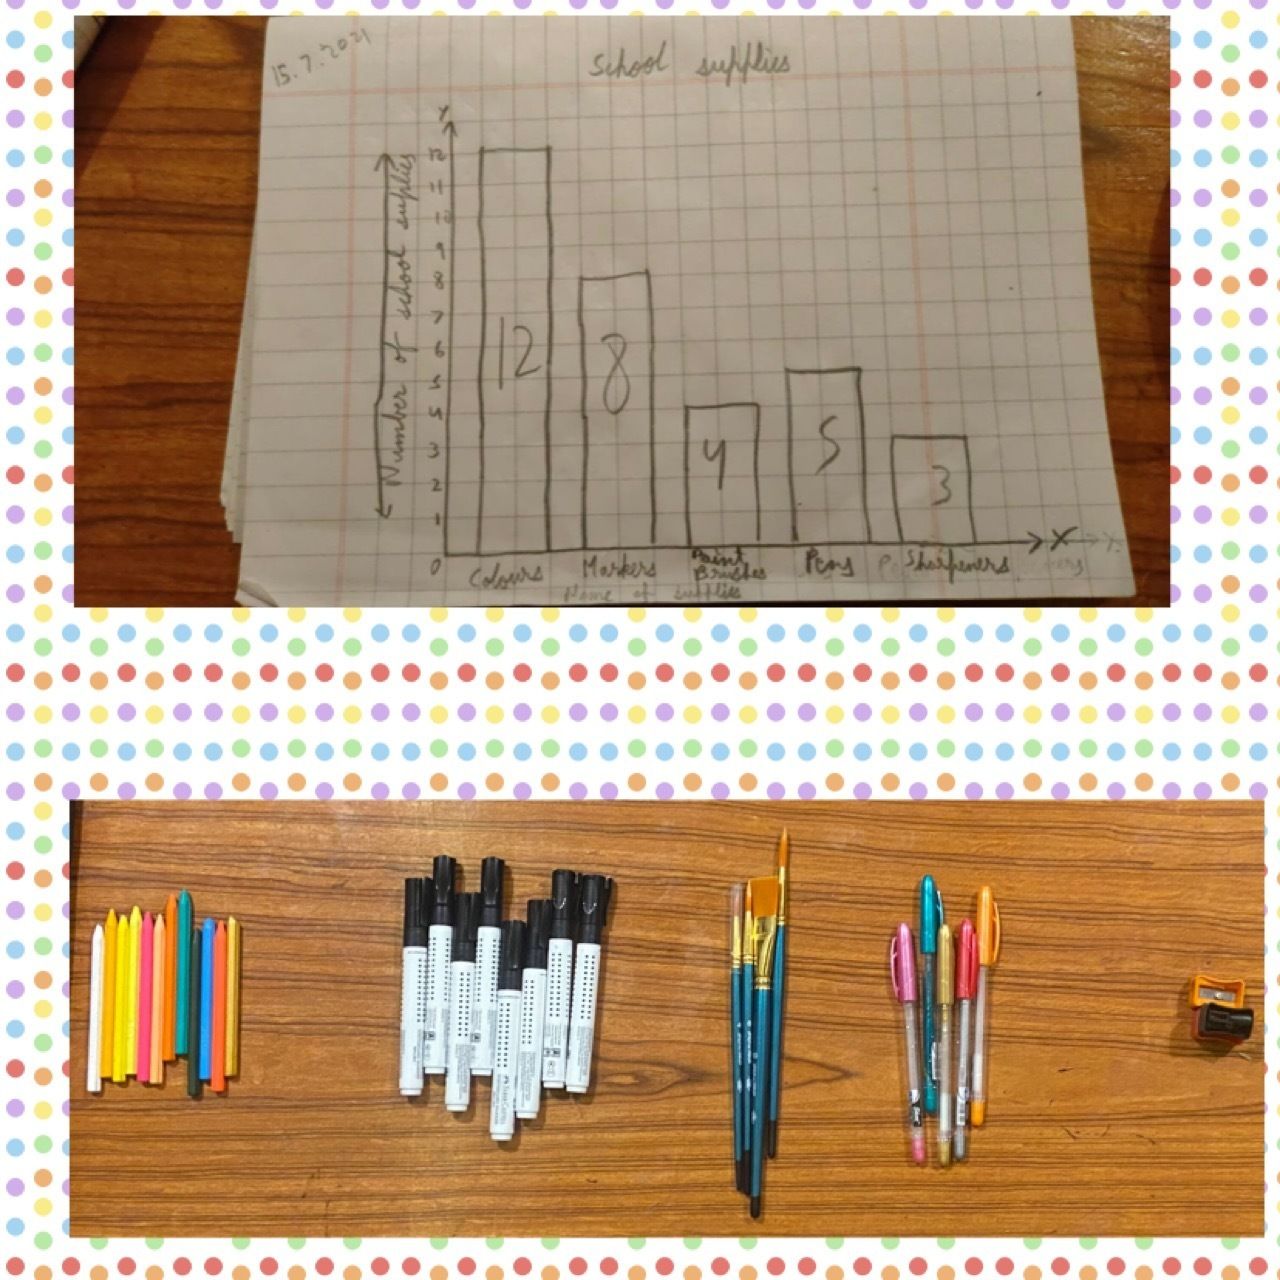
This bar-graph shows the number of school supplies on the table. The height of the bars shows the number of supplies in each category.
Mostrar resumen completo Ocultar resumen completo

Similar

Maths
xcathyx99
Maths Revision
Asmaa Ali
AS level geography- Geographical Skills
beth2384
General Notes for Imperfect Competition
Ashley Hay
Line graph description
Jessica Viviana Toledo
velocity-time graphs
ILMDB
C2 4.1 How Fast?
Meredith Fletcher
Macro Economics 1
ching__e
AS Level Physics Lesson 5 Uniformly Accelerated Motion Quiz #2
Jeffrey Piggott
Maths Preparation
gareth.mallinson