
Mapa mental
Ethnic Minorities
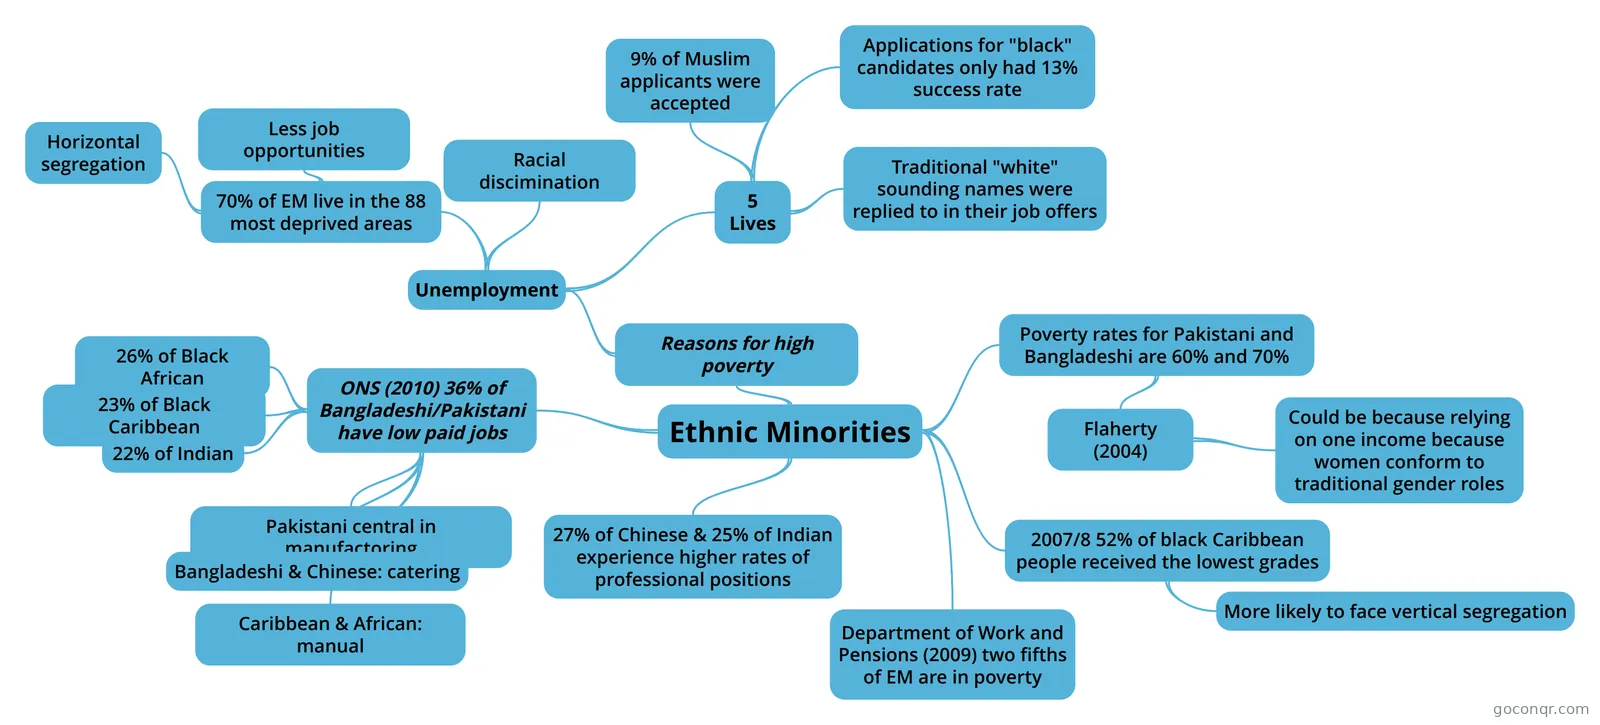
Mind map: Ethnic minorities and poverty
Contenido del mapa
Ethnic Minorities
Department of Work and Pensions (2009) two fifths of EM are in poverty
Reasons for high poverty
- Unemployment
- Racial discimination
- 5 Lives
- Traditional "white" sounding names were replied to in their job offers
- 9% of Muslim applicants were accepted
- Applications for "black" candidates only had 13% success rate
- 70% of EM live in the 88 most deprived areas
- Less job opportunities
- Horizontal segregation
- Unemployment
Poverty rates for Pakistani and Bangladeshi are 60% and 70%
- Flaherty (2004)
- Could be because relying on one income because women conform to traditional gender roles
- Flaherty (2004)
2007/8 52% of black Caribbean people received the lowest grades
- More likely to face vertical segregation
ONS (2010) 36% of Bangladeshi/Pakistani have low paid jobs
- 26% of Black African
- 23% of Black Caribbean
- 22% of Indian
- Pakistani central in manufactoring
- Bangladeshi & Chinese: catering
- Caribbean & African: manual
27% of Chinese & 25% of Indian experience higher rates of professional positions
Información
- Descripción
- Distribution of Poverty between different Social Groups
- Creado por
- Kirbi
- Visitas
- 36
- Etiquetas
- Valoración