
Mapa mental
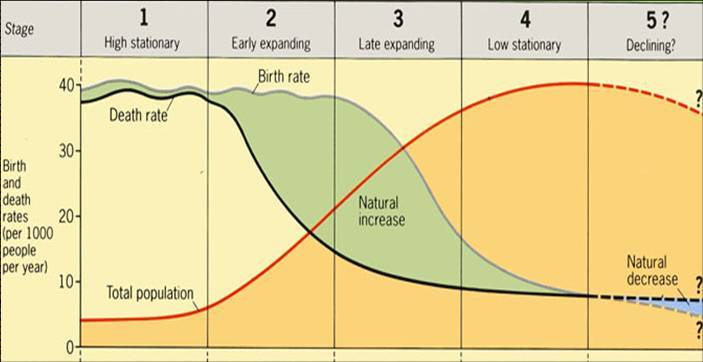
Demographic Transition Model (DTM)
Contenido del mapa
Demographic Transition Model (DTM)
History
- The DTM is based on the demographic changes that occurred in Britain and other developed countries
- The model was originally, put into place to show how the population had changed in developed countries
Stages
- 1 - High Fluctuating
- High Birth rate and Death rate
- Birth rate
- More children needed to provide for the family
- Child mortality is high, so more children are born to keep the family alive
- No/little family planning
- Religious beliefs
- No protection
- Marry young
- Death rate
- High levels of disease
- Bad working conditions
- Famine
- Poor Hygiene
- War
- Birth rate
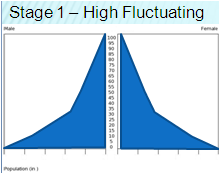
- Concave pyramid shape
- Total population is low
- e.g. Remote groups
- High Birth rate and Death rate
- 2 - Early Expanding
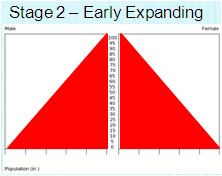
- Classic pyramid shape
- Death rate starts to decrease
- Better Education
- Better living conditions
- Better access to food
- Decreased child mortality
- Better access to doctors
- Infants get vaccines against disease
- Higher quality food
- Birth rate stays high
- Total population starts to expand
- e.g. Kenya
- 3 - Late Expanding
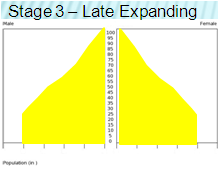
- Pyramid starts to even out
- Death rate stay's low
- Birth rate starts to decrease
- Country is more developed, so people start to focus on work
- Less children are needed to work on the land
- Better healthcare
- More children will survive
- Family planning used
- Rapid urbanisation lessens capacity for large families
- Total population starts to grow
- e.g. Brazil
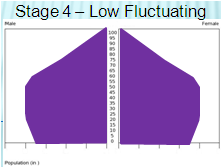
- 4 - Low Fluctuating
- Pyramid starts to become top-heavy
- Total population stays high
- Death rate stay's low
- Birth rate becomes low
- Increased desire for possessions not family
- Couples choice
- Feminism/ Women's rights
- More women in education, choosing careers over family
- Very low infant mortality
- e.g. UK, USA
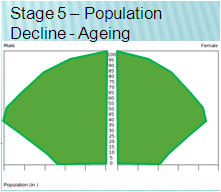
- 5 - Declining?
- Pyramid is top-heavy
- Birth rate stays low/ starts to get lower
- Family planning
- Good health
- Late marriages
- Improving women's status
- Death rate stay's stable at low
- Good healthcare
- Reliable food source
- e.g. Germany
- 1 - High Fluctuating
Strengths
- The DTM gives a good generalised picture of how a population can change over time
- It's timescales are flexible so more countries can 'fit' in with the model
- It's easy to compare countries with only three indictors
- Birth rate
- Death rate
- Total population
- Governments can use the DTM to predict how the population will change and make policies based on this
Weaknesses
- The original DTM did not have a Decling stage (5), this was added when countries like Germany and Japan, exited the low fluctuating stage (4)
- The DTM cannot predict when a country will reach a certain stage,. or for how long a country will stay in a stage for
- The original model was constracted from developed European countries, the USA and Japn, so it may not be a vaild world model
- It is based on the experience of industrialising countries, and therefore may not be vaild for non-industrialising countries such as poor, sub-Saharan African countries
- The DTM is a strong descriptive model, but a weak predictive model
- The DTM does not take into account migration
- Countries in Southern Africa have had their death rate rise, so that it is similar to stage 1 due to dieases such as HIV/AIDS the DTM does not help to predict the future of these countries
Imágenes y archivos del mapa
Información
- Descripción
- A Level (Population) Geography Mapa Mental sobre Demographic Transition Model (DTM), creado por Phoebe Fletcher el 23/04/2015.
- Creado por
- Phoebe Fletcher · abr 2015
- Actualizado
- 6 feb 2018
- Visitas
- 595
- Etiquetas
- Valoración