
Mapa mental
Statistics
Contenido del mapa
Statistics
Type of data
- Quantitative
- Type of data
- Continuous
- It takes any values continuously defined within a specific range
- Discrete
- It takes particular values. It can ben infinite or finite number.
- Continuous
- Usually represented by:
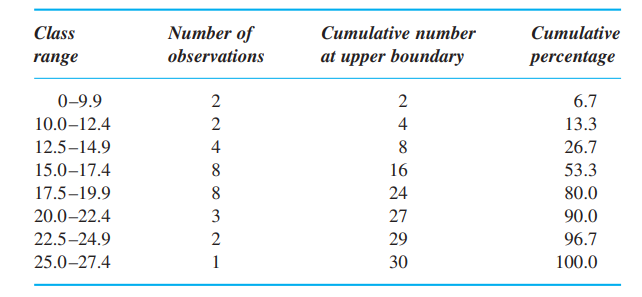
- Cumulative percentage plot
- It shows for any value what proportion of observations were less than that value.
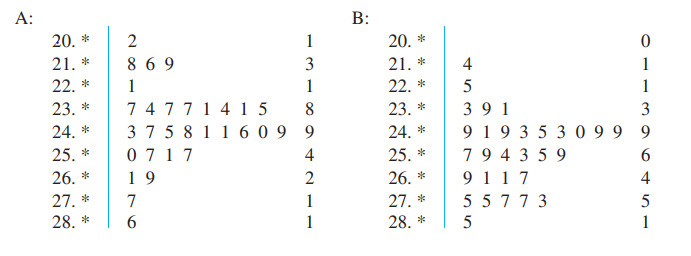
- Stem-and-leaf plot
- Individual values are retained
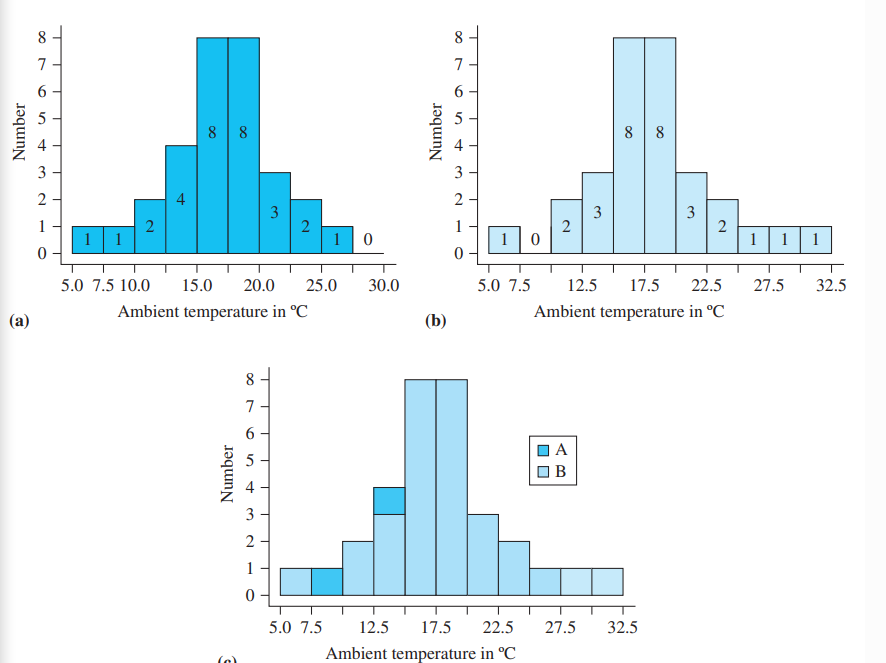
- Histogram
- Cumulative percentage plot
- Type of data
- Qualitative
- Include characteristics and description. *Cannot be numerical
- Usually represented as bar graph or pie chart
- Quantitative
Fundamental requirements
- Any sampling experiment must contain representative samples and successive observations must be independent
Terminology to describe what is observed in an experiment
- Sample space (S)
- Set all of possible outcomes of an experiment
- Event
- Any subset of S
- An event is said to occur if it contains the actual outcome
- Sample space (S)
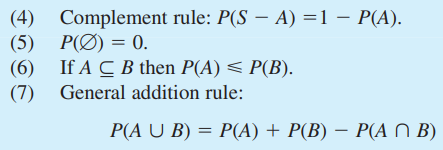
Axioms of probability
Random variables
- S of possible numerical values together with a probability over those values
- Discrete
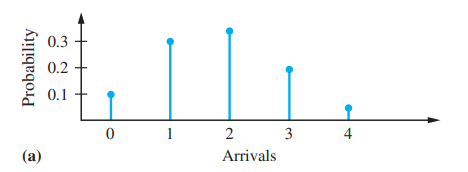
- The behaviour can be represented graphically by means of a
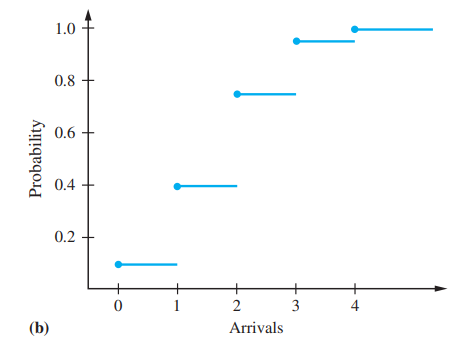
- Distribution function
- Based on the set of point in S and the probability of this event
- Probability mass function
- Distribution function
- The behaviour can be represented graphically by means of a
- Continuous
- The behaviour is described by
- Density function fx(x)
- It has to be understood in terms of the
- Distribution function Fx(x)
- Measure the probability that the value of random variable is less than or equal to the argument x
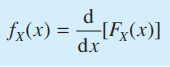
- In this case, because there're no discrete steps in probability, Fx(x) is continuous and differentiable, and its derivative is called
- Probability density function fx(x)
- f indicates the concentration of possible observed values along the real axis
- Probability density function fx(x)
- Distribution function Fx(x)
- It has to be understood in terms of the
- Density function fx(x)
- The behaviour is described by
- Notation: Capital letter for the random value and lower-case for the observe value
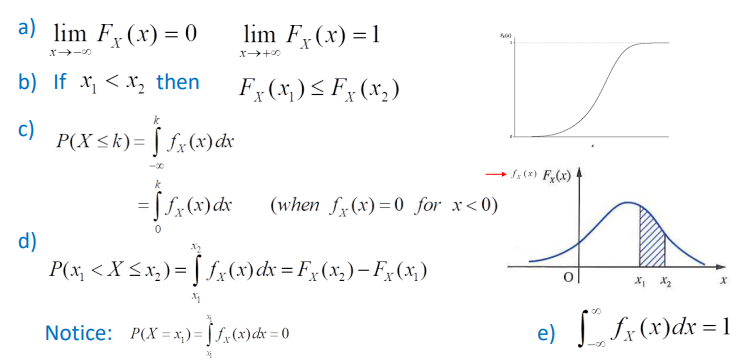
- Properties of density and distribution functions
Measure of location and dispersion
- It is assumed that the random variable is one of a class whose distribution is specified by a formula
- Binomial
- Normal
- Poisson
- Characterize the random variable in terms of two numbers. In practice both are used together
- Location
- 'Typical' value
- Three common measures
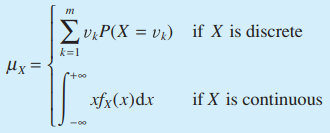
- Mean
- Represented as u_x
- Median
- Continuous random variable
- Discrete random variable
- The median of a distribution does not coincide with mean unless the distribution has an axis of symmetry
- Mode
- It's any point for which the probability density function P_x(mode)(if discrete) or the probability density function f_x(mode)(if continuous) is an overall maximum.
- Two approaches to measure the variation of random variables around their central values
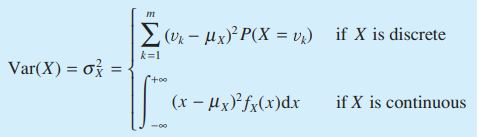
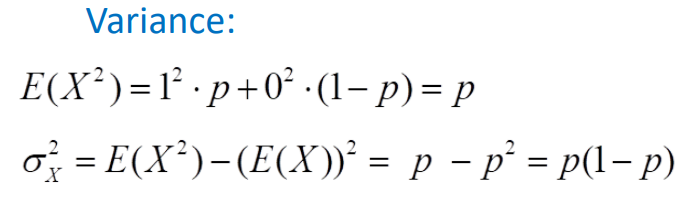
- Variance
- A weighted sum of squared diff. between the possible values and the mean. Written as Var(X) or sigma^2*x
- It measures how tightly concentrated the possible values are about the mean.
- In order to have the result without square unit produce by variance. It is used:
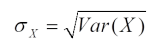
- Standard deviation sigma_x
- Represented as the square root of the variance
- Standard deviation sigma_x
- A weighted sum of squared diff. between the possible values and the mean. Written as Var(X) or sigma^2*x
- Quartiles
- Exploit the distribution function
- Divide the range of possible values of X into four succesive intervals, for each of which the probability of X falling in the interval is one-quarter
- Exploit the distribution function
- Variance
- Mean
- Dispersion
- 'Spread' about that value
- Location
- It is assumed that the random variable is one of a class whose distribution is specified by a formula
Expected values
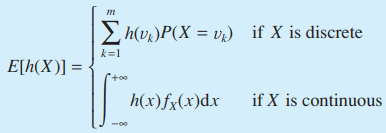
- The mean and variance are special cases of expected values for a random variable.
- The expected value of a function h(X) of X is:
- An alternative expression of the variance:
- The expected value of a function h(X) of X is:
- The mean and variance are special cases of expected values for a random variable.
Independent variable
- When X and Y are independent the so-called joint probabilities can be found from the formula:
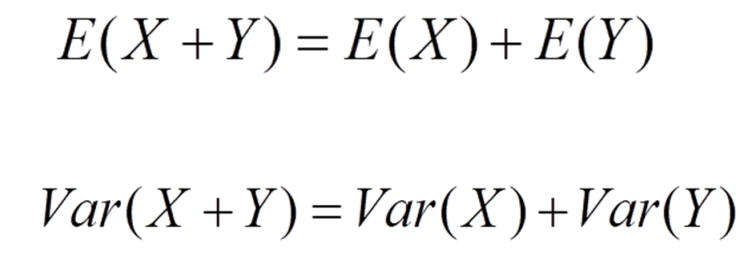
- Properties of the sum of two random variables
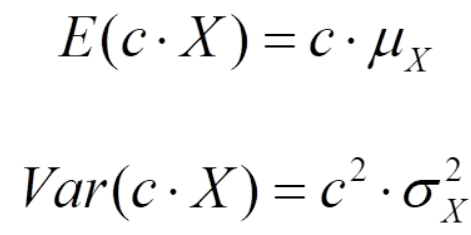
- Adding a constant to a random variable
- Multiplying a constant to a random variable
Measures of sample data
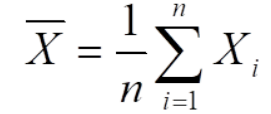
- Sample average
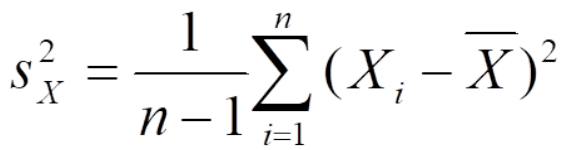
- Sample variance
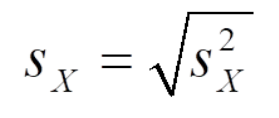
- Sample standard deviation
- The distribution of the quantity under investigation is usually not known
- We need the mean and variance(standard deviation0 to characterize the data)
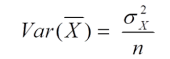
- Variance of sample average
- The sample average /X itself is a random variable (whereas the observed sample mean /x is a number)
- *n: number of data in the sample
- The sample average /X itself is a random variable (whereas the observed sample mean /x is a number)
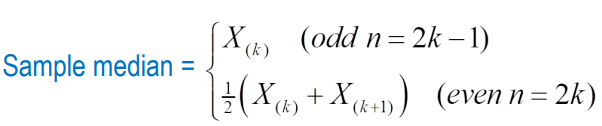
- Sample median
- provides an estimate of the true median
- For small samples a common measure of dispersion is
- Sample range
- diff between the largest and smallest elements of the data set
- Sample range
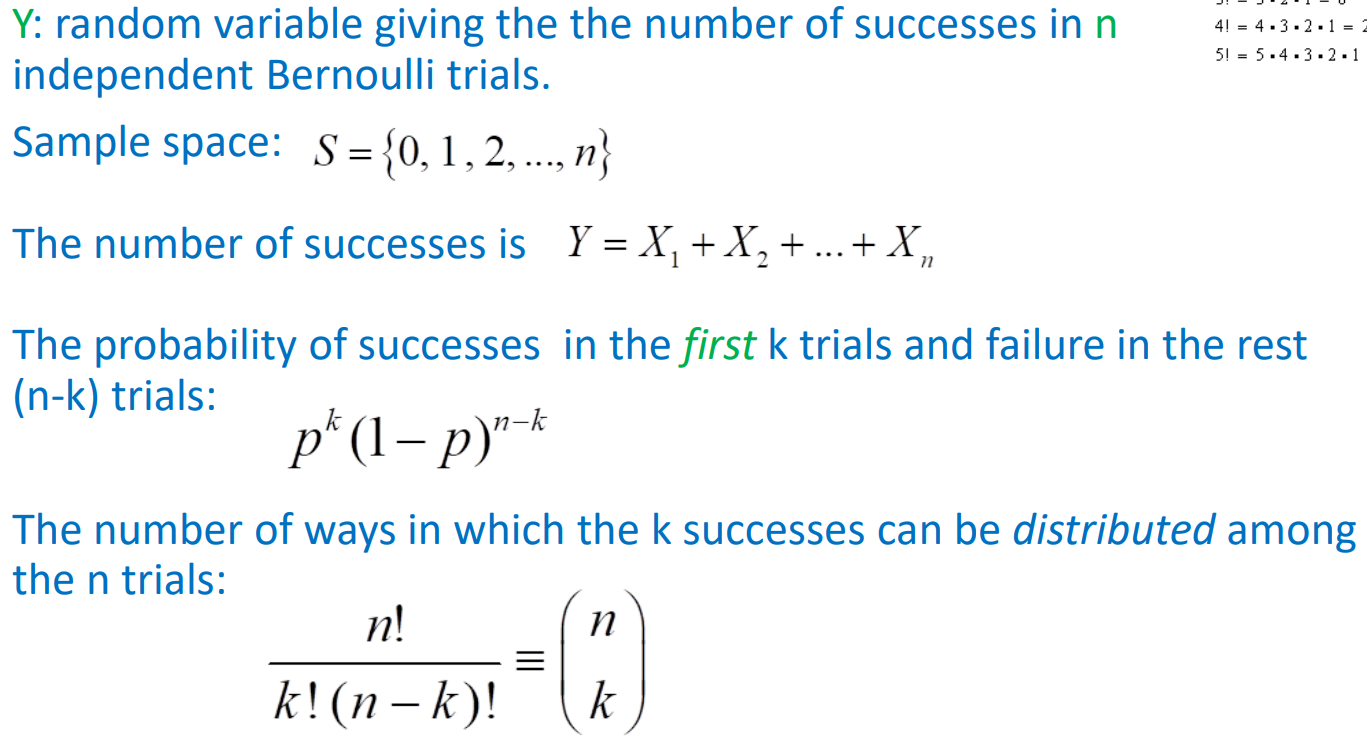
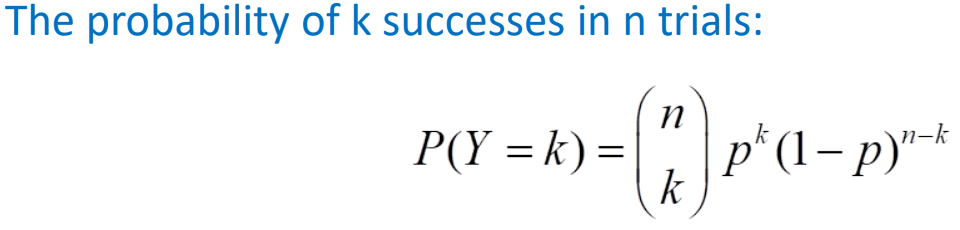
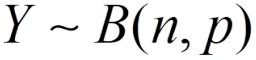
Binomial distribution
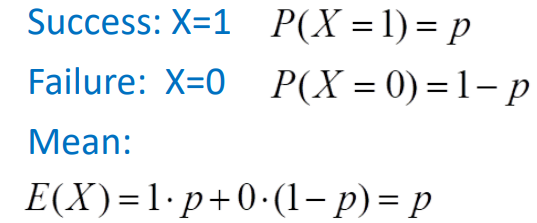
- Bernoulli trial
- Features
- The outcome can be classified as either a success or a failure
- The probability of success is p and the probability of failure is 1-p
- Bernoulli random variable X is a variable assigned to represent the successes in a Bernoulli trial
- Features
- Bernoulli trial
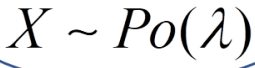
Poisson distribution
- Distribution without upper limit
- X is the number of times an event happens
- x is said to have Poisson distribution with parameter λ and density function
- it can be shown that
- For a large "n" and small "p" the Poisson distribution approximates the binomial with λ=np
- This approx. can be used if
The normal distribution
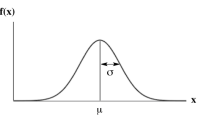
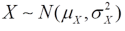
- A continuous random variable X has a normal distribution with mean micro_X and standard deviation sigma_x its density function is
- The graph of the density function is symmetrical about micro_x
- Distribution function
- Traditional solution by use of table giving values of the (cumulative) distribution function. *pg1078
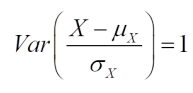
- Variance
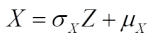
- Any normal random variable X can be considered to have been obtained from a standard normal random variable Z
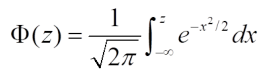
- The standard normal cumulative distribution function is
The central limit theorem
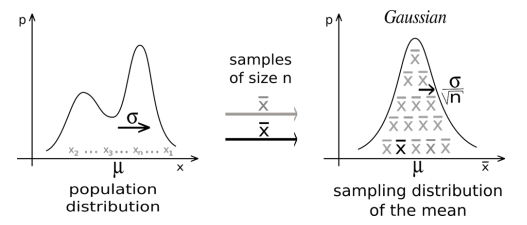
- With sufficiently large random samples it's possible to compute:
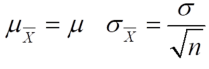
- Mean of the sample means
- Standard deviation of the sample means
- The sample means will be approx. normally distributed, provided the sample size is sufficiently large (usually n>25/30) and :
- With sufficiently large random samples it's possible to compute:
Imágenes y archivos del mapa




















Información
- Descripción
- Mapa Mental sobre Statistics, creado por Hoprap Padilla el 18/07/2023.
- Creado por
- Hoprap Padilla
- Visitas
- 0
- Valoración