
Mapa mental
Sociology - Life Expectancy and Infant Mortality
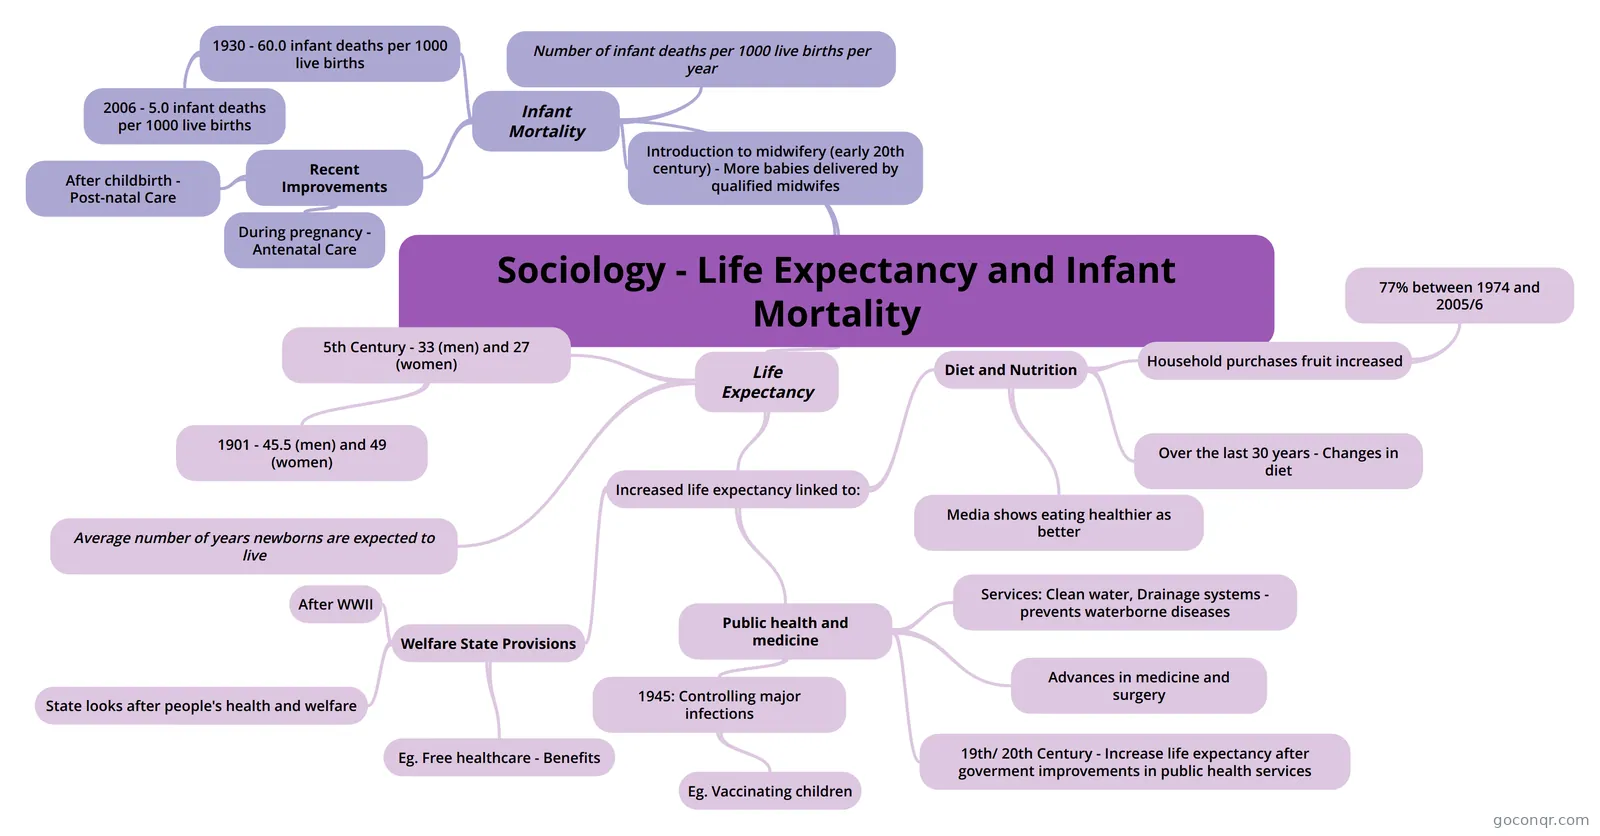
Mind map: sociology life expectancy and infant mortality
Contenido del mapa
Sociology - Life Expectancy and Infant Mortality
Life Expectancy
- 5th Century - 33 (men) and 27 (women)
- 1901 - 45.5 (men) and 49 (women)
- Average number of years newborns are expected to live
- Increased life expectancy linked to:
- Welfare State Provisions
- After WWII
- State looks after people's health and welfare
- Eg. Free healthcare - Benefits
- Diet and Nutrition
- Over the last 30 years - Changes in diet
- Media shows eating healthier as better
- Household purchases fruit increased
- 77% between 1974 and 2005/6
- Public health and medicine
- 19th/ 20th Century - Increase life expectancy after goverment improvements in public health services
- 1945: Controlling major infections
- Eg. Vaccinating children
- Advances in medicine and surgery
- Services: Clean water, Drainage systems - prevents waterborne diseases
- Welfare State Provisions
- 5th Century - 33 (men) and 27 (women)
Infant Mortality
- 1930 - 60.0 infant deaths per 1000 live births
- 2006 - 5.0 infant deaths per 1000 live births
- Number of infant deaths per 1000 live births per year
- Recent Improvements
- During pregnancy - Antenatal Care
- After childbirth - Post-natal Care
- Introduction to midwifery (early 20th century) - More babies delivered by qualified midwifes
- 1930 - 60.0 infant deaths per 1000 live births
Información
- Descripción
- Mapa Mental sobre Sociology - Life Expectancy and Infant Mortality, creado por ILilley el 14/10/2014.
- Creado por
- ILilley
- Visitas
- 36
- Etiquetas
- Valoración