
Apuntes
Descriptive stats module 1 Part 1
Contenido del apunte (2)
Página 1
https://youtu.be/0ZKtsUkrgFQ - video
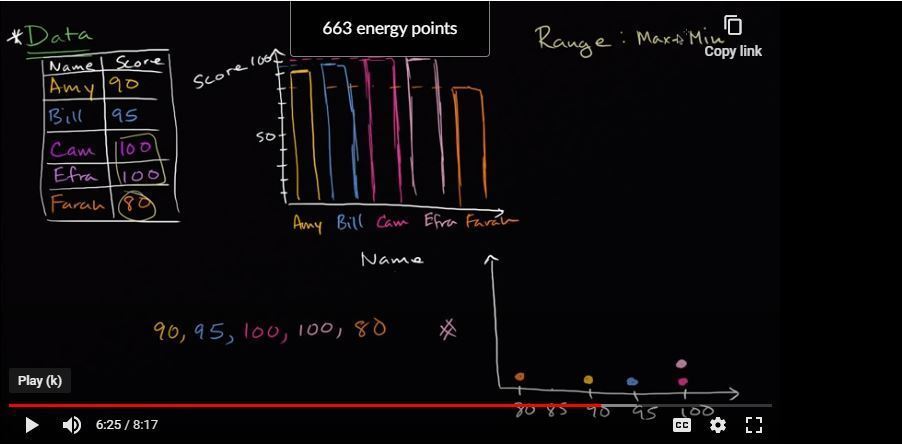
these are various desp ways to represent datafreq plot , bar graph m], tables and other stuff
Página 2
freq tables and box plots
Información
- Descripción
- stats statistics Apunte sobre Descriptive stats module 1 Part 1, creado por tejesh bhalla el 11/06/2020.
- Creado por
- tejesh bhalla · jun 2020
- Actualizado
- 11 jun 2020
- Visitas
- 0
- Etiquetas
- Valoración