
Test
Line graph description
Este test tiene tipos de pregunta que se abren en el reproductor de siempre.
Preguntas del test (13)
1This test is about verbs and related phrases to describe a line graph.
Are you ready?.... Click on TRUE
- AVerdadero
- BFalso
2Classify the verbs according to the movement in the graph that they describe.

- Asoar
- Bfall
- Cremain steady
- Dfall
- Esoar
- Fremain steady
- Gfall
- Hsoar
- Iremain steady
- Jreach a plateau
- Krise
- Lplunge
- Mrise
- Nplunge
- Oreach a plateau
- Prise
- Qplunge
- Rreach a plateau
- Smaintain constant
- Trocket
- Udrop
- Vrocket
- Wdrop
- Xmaintain constant
- Yrocket
- Zmaintain constant
- AAdrop
- ABplummet
- ACgrow
- ADstabilize
- AEgrow
- AFplummet
- AGstabilize
- AHplummet
- AIgrow
- AJstabilize
3Drag the phrases to describe the graph.
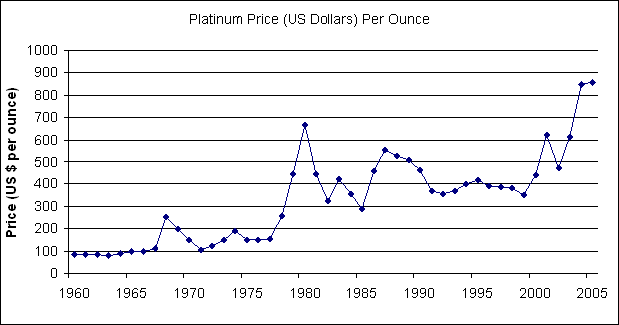
- AThere was a peak.
- BThe price remained steady.
- CThe price rocketed.
- DThe price fluctuated.
- EThe price dropped.
- FThe price fluctuated wildly.
4The following verbs describe graphs. What is their form in past tense?
a) rise - [blank_start]rose[blank_end]
b) grow - [blank_start]grew[blank_end]
c) fall - [blank_start]fell[blank_end]
d) sink - [blank_start]sank[blank_end]- Arose
- Bgrew
- Cfell
- Dsank
5Look at the graph. Is this sentence describing it?
The trend in customer number was upward.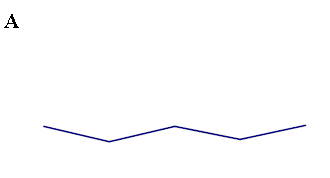
- AVerdadero
- BFalso
6Look at the graph. Is this sentence describing it?
The numbers fell drastically.
- AVerdadero
- BFalso
7Look at the graph. Is this sentence describing it?
There was a slight dip in sales numbers.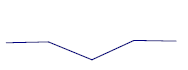
- AVerdadero
- BFalso
8Look at the graph, decide which statements are correct in each case.
There may be more than one answer.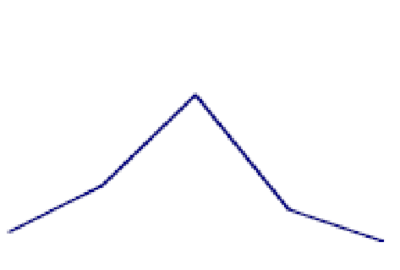
- ACustomer numbers hit a peak.
- BThere was a peak in customer numbers.
- CThere was a slight dip in customer numbers
- DThe trend in customer numbers was flat.
9Look at the graph, decide which statements are correct. There may be more than one option.

- AThere was a downward trend in customer numbers.
- BCustomer numbers were erratic.
- CThere was a gradual rise in customer numbers.
- DThere was a steady fall in customer numbers.
10Look at the graph and choose a suitable verb to complete the graph description.
This is a line graph of sales - the blue line represents air conditioner sales, the red line shows heaters.
As you'll note, air conditioner sales [blank_start]dropped[blank_end] steadily from January to July, [blank_start]bottoming out[blank_end] then.
On the other hand, heater sales experienced a sharp [blank_start]increase[blank_end] from March to June, then dropped markedly from June to July, after that, they declined through to September, with a pronounced drop in October.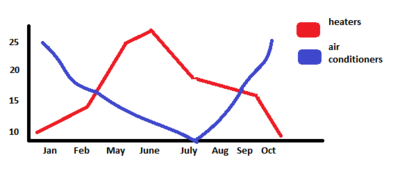
- Adropped
- Brose
- Cfluctuated
- Dsoared
- Ebottoming out
- Flevelling off
- Ghitting a peak
- Hgoing up
- Iincrease
- Jwent up
- Kflat
- Lgrow
11Look at the graph, what is your conclusion? Fill in the gap with ONE word.
All in all, there were wild [blank_start]fluctuations[blank_end] along the period.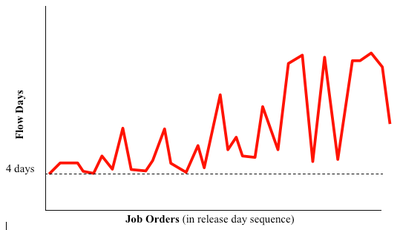
- Afluctuations
12Complete the following sentences with ONE preposition.
a) The graph compares the number of customers [blank_start]from[blank_end] 2010 to 2016.
b) They experienced an upward trend, starting the period [blank_start]at[blank_end] approximately 500 units.
c) The price of the raw materials increased [blank_start]by[blank_end] 30%.
d) The last decade has seen a steep increase [blank_start]in[blank_end] the number of social networks users.
e) The number of sales dropped [blank_start]to[blank_end] 100 per month.- Afrom
- Bat
- Cby
- Din
- Eto
13Read the following text.
Insert the phrases that are missing to complete the graph description:
[blank_start]The graph shows changes in the number of[blank_end] farms and farm workers in the USA between 1910 and 2000. Overall, there was a huge drop in the number of workers and farms over the period.
[blank_start]The biggest change was in the number of[blank_end] farm workers. In 1910 there were almost 14 million agricultural workers in the US. This number remained relatively stable for twenty years, dropping only to about 13 million in 1930. [blank_start]However, between 1930 and 1975[blank_end] the number of labourers plunged. It fell from 13 million in 1935 to just over 4 million in 1975, a drop of about 66%. From 1970 to about 1990 the number continued to decrease, and from 1990 numbers appeared to level off at about 3 million.
The number of farms [blank_start]followed a similar decline[blank_end]. Between 1910 and 1940 the number of farms remained usually at about 6.5 million. After 1945, the number started to drop. It fell from 6 million in 1945 to just under 3 million in 1975, a fall of 50%. In the last twenty years of the century;however, the number remained stable at just over 2 million.
[blank_start]In conclusion, the number of[blank_end] farms and workers in America plummeted [blank_start]over the 100 year period[blank_end].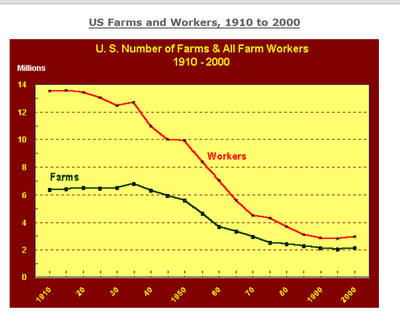
- AThe graph shows changes in the number of
- BThe biggest change was in the number of
- CHowever, between 1930 and 1975
- Dfollowed a similar decline
- EIn conclusion, the number of
- Fover the 100 year period
Información
- Descripción
- Test vocabulary and phrases related to line graphs.
- Idioma
- English
- Visitas
- 931
- Etiquetas
- Valoración
- Aún sin valoraciones Valora este test