
Flashcards
Bloque II
Cards in this deck (119)
- 1What does correlation study?How much variability is SHARED between variables
- 2Which relationship between variables does correlation stipulate?Simple association between variables, NO prediction nor causality
- 3What does regression study?How much variability of Y is EXPLAINED by variable X
- 4Which relationship between variables does regression stipulate?Causal o funcional
"Y changes as a function / cause of X" - 5How do we call variable X?Predictor or independent variable, aka regressor or explanatory variable
- 6Which is the PREDICTOR variable?Variable X
- 7Which is the INDEPENDENT variable?Variable X
- 8How do we call variable Y?Explained, 'criterio' or dependent variable
- 9Which is the EXPLAINED variable?Variable Y
- 10Which is the CRITERIO variable?Variable Y
- 11Which is the DEPENDENT variable?Variable Y
- 12Three requisites for establishing causality between two variablesCovariation / linear relation
Temporal ordering
Elimination of competing explanations - 13Where do we put variable Y?Abscissa axis (vertical)
- 14Where do we put variable X?Ordinate axis (horizontal)
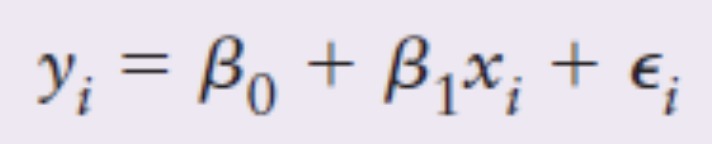
- 15What is the expression of the GENERAL SIMPLE LINEAR REGRESSION MODEL?
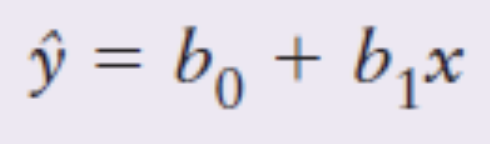
- 16What is the expression of the SAMPLE REGRESSION MODEL?
- 17What is this?The expression of the GENERAL SIMPLE LINEAR REGRESSION MODEL
- 18What is this?The expression of the SAMPLE REGRESSION MODEL
- 19What is the expression for the slope coefficient?
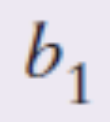
- 20What is this?The slope coefficient
- 21What is the expression for the intercept coefficient?
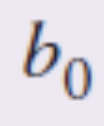
- 22What is this?The expression of the intercept coefficient
- 23What is the expression for the fitted / estimated values?
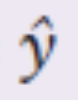
- 24What is this?The expression for the fitted / estimated values
- 25What is LINEAR REGRESSION?Method of obtaining prediction relation between Y and X using least-squares method and obtaining a linear relation of Y-X with slope and intercept coefficients
- 26What does least-squares method do?Minimizes the square of the distance between fitted values and real observed values
- 27What is the EXPLAINED distance variability?The distance from the fitted value to the mean value of Y (null-model)
"How much better the regression model is than the null model" - 28What is the distance from the fitted value to the mean value of Y?Explained variability
- 29What is the UNEXPLAINED distance variability?The distance from the fitted value to the real observed value
"How away the regression model is from the observed values" - 30What is the distance from the fitted value to the observed value of Y?Unexplained variability
- 31What is R-squared?The estimator of % of variability of Y that is explained by the variability of X
- 32What is the estimator of % of variability of Y that is explained by the variability of X?R-squared
- 33What is CV (Coefficient of Variation)?The percentage of variability around the regression line (should be less than 10%)
Another measure of model fit - 34Definition of INTERCEPTThe value of Y expected when X is = 0
- 35Process for making intercept importantCentering
- 36Definition of SLOPEChange in Y when X is increased by 1 point
(sometimes this doesn't make sense and thus we transform it) - 37Definition of CONFIDENCE INTERVAL for point estimatesInterval for finding average of fitted values for all subjects that take a specific X value
- 38Definition of PREDICTION INTERVAL for point estimatesInterval for finding specific fitted values for a subject that took a specific X value
- 39Which one is wider, confidence interval or prediction interval?Prediction interval
- 40Which one is narrower for the range of observed values, confidence interval or prediction interval?Confidence interval
- 41What H0 does the p-value test for slope coefficients?Whether if that slope is equal to 0
- 42What H0 does the p-value test for the whole model?Whether if the model has the same predictive capacity as the null model (using the mean)
- 43Why do we study the confidence interval for slope coefficients?For seeing if it has 0. If it does, it is then likely that the slope is 0, then it is not significantly different from 0
- 44What does high leverage mean?Values that are away from the range of X values
- 45What does low leverage mean?Values that are in the range of X values
- 46What is the expression of leverage?Hat-values
- 47What are hat-values?Leverage values
- 48What does high discrepancy mean?Values that are distant from the regression line; high residual
- 49What does low discrepancy mean?Values that are close to the regression line; low residual
- 50What is the measure of influence of values?Cook's distance
- 51What is Cook's distance?The influence of values
- 52What is large influence?Values that exceed the formula:
2x(k+1/n)
k = predictors
n = subjects - 53What is SIMPLE LINEAR REGRESSION?Regression model that only uses one predictor (X)
- 54How do we call the model that only uses one predictor XSimple linear regression
- 55Assumptions of linear regression- X measured in interval
- Y measured in interval
- Linear relation between X-Y
- Random sampling
- Normal residual
- Homocedastic residual
- Independent residual - 56How to test linear relation between X-YCorrelation
Plot visualization
RESET test - 57How to test homocedastic residualPlot of residuals with no pattern and no different variability
Levene test
Breusch-Pagan test - 58RESET testUsed to test linear relation between variables
- 59Levene testUsed to test homocedastic residual
- 60Breusch-Pagan testUsed to test homocedastic residual
- 61How to test normality of residuals?Normal Q-Q plot
Histogram
Shapiro-Walk test
Kolmogorov-Smirnov test - 62Shapiro-Walk testTesting for normality of residuals
- 63Kolmogorov-Smirnov testTesting for normality of residuals
- 64How to test for independent residual?Durbin-Watson test
- 65Durbin-Watson testTesting for independency of residual
- 66Which values are equal in simple linear regression?The p-value of the only slope, the p-value of the whole model, and p-value of R-squared change
- 67What is MULTIPLE LINEAR REGRESSION?Regression model that uses more than one predictor
- 68How do we call the model that uses more than one predictorMultiple linear regression
- 69Why do we use adjusted R-squared?For multiple linear models in which adding variables can artificially increase R-squared
- 70What is multicolinearity?The case in which predictors are linear related and thus prompt high overall R-squared but no significant predictors alone (p>0,05). It can also cause predictors to have unexpected signs.
- 71Testing for multicolinearityTolerance: 1-Rsquared(adjusted)
We want it to be close to 1, it means that there is no multicolinearity
VIF: 1/tolerance
We do not want it to be close to 1, it means that there is no multicolinearity - 72What does TOLERANCE measure?Multicolinearity
Want it close to 1 - 73What does VARIANCE INFLATION FACTOR measure?Multicolinearity, we want it close to 1
- 74Entry method SIMULTANEOUSAll variables are entered together
If there is multicolinearity, we can't know the percentage of overlap between predictors - 75Entry method HIERARCHICALWe enter variables by steps
If there is multicolinearity, we can see how much change in R-squared they add
Helps us decide which variable is useful
Helps us control for variables at the beginning - 76Entry method STEPWISEWe enter variables and the program comes up with a model that is approximated to values
Minimum N=40
SPSS: all variables entered are significant
R: uses AIC or BIC - 77Entry method VARIABLE SCREENING METHODGiven predictors and a number k of predictors to retain, offers the best model that satisfies the best criterion
- 78Solutions to overfitting(1) Dividing the dataset in building the model and testing the model
(2) Making K-1 portions - 79Definition of moderation analysisThe prediction relation Y-X is influenced by a variable W. There is interaction between X and W.
- 80Procedure for moderation analysisCreate a variable that multiplies, and add it as a last step in hierarchical (or simultaneous). See how much it contributes, delete if not significant.
- 81Moderation analysis with a categorical variable that moderatesCreate a variable that multiplies, and add it as a last step in hierarchical (or simultaneous). See how much it contributes, delete if not significant.
- 82Moderation analysis with a quantitative variable that moderatesCategorize the variable; define quantiles. Create a variable that multiplies, and add it as a last step in hierarchical (or simultaneous). See how much it contributes, delete if not significant.
- 83Definition of mediation analysisY can be predicted by X but also by M that is predicted, in turn, by X
aka "path analysis" - 84Classical procedure for mediation analysis(1) Checkin prediction Y-X
(2) Checking prediction M-X
(3) Checking prediction Y-M & Y-X (simult.)
If both significant: partial
If Y-M significant but Y-X not: complete
If Y-X significant but Y-M not: no mediation - 85Which entry method is used for moderation?Hierarchical
- 86Which entry method is used for mediation?Simultaneous
- 87Modern procedure for mediation analysis(1) Checking prediction M-X
(2) Checking prediction Y-M and Y-X
(3) Obtain product of the two estimates
(4) Bootstrap indirect effects to construct CI, we do not want to see 0 - 88Definition of ANCOVA analysisWant to see if X predicts Y even after controlling for Covariate
X: categorical
"Are means of Y equal between X1-X2 for all Cov values?" - 89Requisites for Cov variablesRelated with DV
Unrelated with IV or other Cov (if it is, HIERARCHICAL entry, and enter it at first step) - 90Assumptions added for ANCOVA- Normal distribution of Cov
- Reliably measured Cov
- Linear relation Cov-DV (scatter/Pearson)
- No relation Cov-IV
- No interaction Cov-IV - 91How to test for linear relation Cov-DVScatter plot (visually)
Pearson correlation - 92How to test for no relation Cov-IVIf Cov is measured before application of IV, then it is assumed they are not related
If not, (1) use multicolinearity procedure, or (2) see t-test for equivalency of means of Cov for each IV group - 93How to test for homogeneous slopesSame procedure as in moderation: add interaction factor and see if it adds power to the model. If unmet, use Johnson-Neyman technique
- 94What do we use Johnson-Neyman technique for?For when slopes are heterogeneous in ANCOVA
- 95Which eta-square does ANCOVA test?Partial correlation: what the variable adds with respect to what is NOT already explained

- 96Partial correlationWhat the variable adds with respect to what is NOT already explained
- 97Which eta-square does REGRESSION test?Semipartial correlation: what the variable adds with respect to ALL THAT COULD be explained

- 98Semipartial correlationWhat the variable adds with respect to ALL THAT COULD be explained
- 99What are POLYNOMIAL MODELS?Models that do not look linear but that hold a linear expression
- 100Quadratic model expression

- 101Cubic model expression

- 102How many predictors does a cubic model have?Just 1, in three versions
- 103Procedure for testing polynomial modelsHierarchical entry for each model in each step
- 104How to choose a polynomial model?The one that best approximates the data, it is easier to interpret (slopes, intercepts) and generalizable (not too much overfitting)
- 105Problem of polynomial modelsSensitivity to outliers
- 106Solution for outliers problems in polynomial models(1) Testing the model without them
(2) LOESS
(3) B-SPLINES - 107LOESS characteristicsYou choose the length of the portion (alpha)
Overlapping
Difficult to interpret
Does not have a linear expression
Less sensible to outliers - 108The larger LOESS portions...The smoother
- 109The narrower LOESS portions...The rougher
- 110B-SPLINES characteristicsYou choose the knots
No overlap
Difficult to interpret (but this better)
Does not have a linear expression
Less sensible to outliers - 111What are linearizable models?Models that do not look like lines but that can be transformed to look like lines and have a linear expression
- 112Procedure of transforming into linearizable modelsTukey & Mosteller rule
- 113Tukey & Mosteller ruleProcedure of transforming into linearizable models
- 114Example of linearizable modelExponential model
- 115Advantages and disadvantages of linearizable models- Uses ordinary least estimations
- More difficult to interpret because it has transformations
- Doesn't work for all - 116Intrinsically nonlinear models definitionModels that are intrinsically nonlinear: do not look that lines and can't be expressed in lines
- 117Advantages and disadvantages for intrinsically nonlinear models- If you got them, it is because there is theoretical basis on them
- Doesn't use least square estimation
- Needs for sensitive analysis - 118Examples of intrinsically nonlinear modelsLogistic and Gompertz models
- 119Difference between logistic and Gompertz modelsGompertz: increase more smooth
Logistic: increase more abrupt
Information
- Description
- Máster MÉTODOS ESTADÍSTICOS Flashcards on Bloque II, created by Ana Bautista on 30/01/2022.
- Created by
- Ana Bautista
- Views
- 7
- Rating