
Flashcards
research methods lecture 7
Cards in this deck (17)
- 1linear regression- it assumes a linear relationship between two variables
- it assumes that the data are similarly spread out along all values of y
it can be used to predict one variable from the other - 2homoscedasticwant our data to be homoscedastic in order to carry out a linear regression on the data
homoscedastic - data is equally around the regression line - 3residualsyou get as many residuals as you do data points
- 4what is different for linear and multiple regression?- procedure for fitting model to data
- 5linear and multiple regression- allows us to retain precise info about predictors (regression)
- predictions on basis of regression equation are subject to error (residuals)
- may just want to use model to see relative importance of different predictors - 6multiple regressionMultiple regression is an extension of linear regression. Psychologists are interested in using this technique in order to discover the ways in which several variables (called explanatory or predictor variables) are related to another (called the dependent or criterion variable).
The criterion variable is still called y , but this time we have several explanatory variables, denoted x 1 , x 2 , x 3 and so on. - 7multiple regression part 2Multiple regression is able to give us information on the ways in which the explanatory variables combined relate to the criterion variable, and it is also able to give us information on how each of the variables relates to the criterion variable, separately.
- 8the equation of a straight lineThe equation is just an extension of the linear regression:
Y = b0 + b1X
b0 = Y when X=0
b1 =change in Y /change in X
if you have more than one predictor you might hae lots of b's - 9—X1 X2 = two predictors
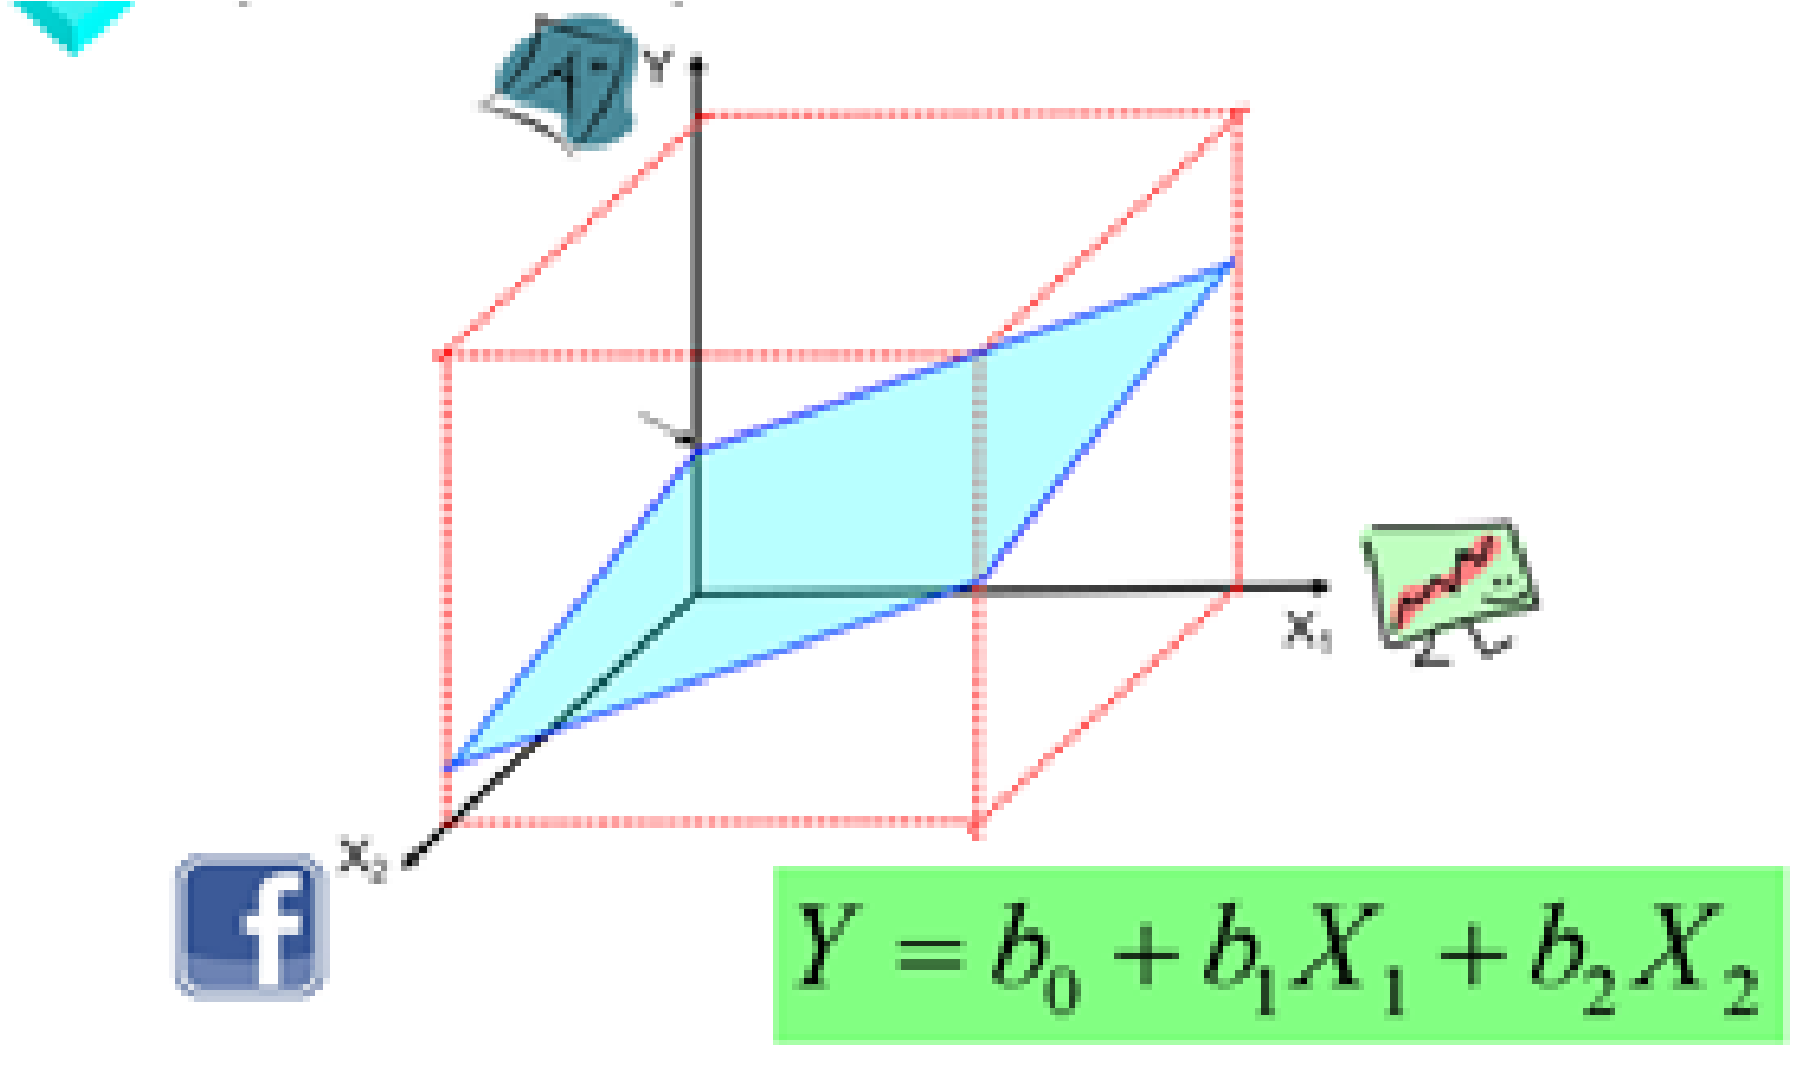
imagine this is a three dimensional space in which you will put these slopes
You can create two slopes here and you can see they meet at the same point
You need a plane to get these in the same place - can use this as a model of our data
equation of the plane is similar to the equation of the line - 10residuals and planes- seeingwhere the residuals are the line is harder to see than on a plane
- You flatten it all out and plot them on two dimensions
- This kind of residuals plot is not used too much in the model
- we do use another kind in which we plot a histogram of residuals
- when this is normally distributed, it is OK to do regression analysis
- not checking the normality of our DVs and IVS
- it is important that our residuals are normally distributed - 11more than two predictors- You can do it with more than two predictors - you can do it with 100 predictors, but it would probably only explain a little bit of the variance each, they may also overlap with each other
- you can have interest in RMD, facebook, IQ score
with 3 dimensions might be difficult to do plane - might look like a cube
- we can predict all these predictors
- we can see how much it predicts on their own but how much they predict each other - 12multi - collinearitythis is when predictora are correlated with one another as well as the DV
- we get some of the variables explaining some of the same variance in the DV
So the amount of unique information provided by each variable is reduced.
- If collinearity is too high some variables will be dropped all together
- high multi-collinearity - you shouldn't really be running this part of the model - doesn't tell us anything new - you might leave one of the two predictors in - can leave it in but not as strong - 13part correlation- we isolate the unique contribution each predictor/IV makes explaining the variance in the criterion/ DV -> part correlations
for example DV = RMD
predictors/IVs = IQ and time spent on Facebook
we can look at the part of the entire variance in RMD grase (DV) that is uniquely explained by time spent on facebook and then the sme for IQ - 14partial correlationproportion of variance once othe relationships are accounted for/partialled out
the influence of one predictor/IV is partialled out
The amount of unique variance expalined by the predictor/IV as a proportion of the variance in the DV that is explained by anything - 15example of partial correlationvariance in RMD grade explained by IQ (taking into account variance explained by Time on Facebook)
we can now partial out the influence of time spent on Facebok
We can now look at how much of the remaining partial peice of variance in RMD Grade (DV) is uniquely explained by IQ - 16regression is most effective if..predictors are not to o strongly inter-correlated
- 17What was that all about?isolatw what each predictor adds to our understanding of the criterion -> more effective model
in psychological terms: how much extra of differences in people's scores can be explained by each additional relationship - importance of each relationship plays in making sense of behaviour
- need to know where they overlap - might not explain new variance
Information
- Description
- Flashcards on research methods lecture 7 , created by Toyin O on 06/03/2018.
- Created by
- Toyin O
- Views
- 0
- Rating