
Flashcards
Lecture 10
Cards in this deck (62)
- 1Who 'invented' simple and multiple regression & where did linear regression come from?Francis Galton in the 19th century
&
The idea of regression to the mean. - 2What does regression to the mean refer to?Regression toward (or to) the mean is the phenomenon that if a variable is extreme on its first measurement, it will tend to be closer to the average on its second measurement—and if it is extreme on its second measurement, it will tend to have been closer to the average on its first.
- 3Is simple and multiple regression common?Multiple regression is quite common, unlike simple regression.
- 4Is simple and multiple regression modern or older in origin?Older
- 5What does regression provide us with?The statistical framework for testing a whole range of models.
1. Linear regression modelling
2. Least squares linear regression modelling
3. Regression modelling
(All mean same thing) - 6What's unique about regression modelling?Regression modelling provides a platform for him to explore the pattern of relationships among these variables.
So it's not just about looking at one variable, multiple regression allows us to look at a number of variables at once. - 7In the language of regression, what does predictor or prediction mean?In regression, we use the term prediction and predictor, but this is just jargon to describe a relationship and doesn’t relate to predicting something in the future.
(It can but doesn't have to) - 8To explain the relationship between one predictor and one dependent variable, what type of regression to we use?Simple univariate regression
- 9What do simple and univariate mean?Simple = one predictor
Univariate = one dependent variable
Example:
The predictor = VCE Psychology
(Also known as X)
The outcome = first year uni psychology
(Also called Y, the criterion variable, the outcome, the DV). - 10What are some other names for: The predictor the outcomeThe predictor = also known as X
The outcome = also called Y, the criterion variable, the outcome, the DV). - 11What's the difference between correlations and regression?You don't think of one of the variables as being the IV or DV, they're just two variables that are interchangeable.
In regression, you declare one of the variables to be the outcome and one of the variables as the predictor. - 12What dictates whether a variable is the predictor or outcome in regression?1. It may just be logical (lecture example)
2. A theoretical or causal pathway e.g. if you think X causes Y. - 13When the direction is plausible either way, what is this called?A bidirectional relationship
- 14How do we explain the relationship between the two variables in this model?By calculating a formula, the
REGRESSION EQUATION,
which explains the relationship between the two variables. - 15What is a model?A statistical model attempts to simplify, idealise and stylise a messy relationship between two variables.
*Think of the fashion model analogy. - 16What doe we want to know in relation to a statistical model?How well it captures the reality
- 17What is the 'line of best fit'?The regression 'model'
It models the relationship between the two variables. - 18What is the regression equation?A mathematical expression of the line of best fit/the regression model.
- 19What is meant by: The model is graphed/calculated in such a way so at to minimise the error of prediction.You can use the line of best fit to (graph) as a predictive tool in a way the best minimises error.
- 20What is simple linear regression?In simple linear regression, we predict scores on one variable from the scores on a second variable. The variable we are predicting is called the criterion variable and is referred to as Y. The variable we are basing our predictions on is called the predictor variable and is referred to as X. When there is only one predictor variable, the prediction method is called simple regression
- 21What is the line of best fit?Line of best fit refers to a line through a scatter plot of data points that best expresses the relationship between those points. A straight line will result from a simple linear regression analysis of two or more independent variables.
- 22What is error of prediction? What's its other name?The difference between what a person actually got and what the model predicted they would get (where the model is getting it wrong).
Residual = fancy name for error. - 23What does this mean? No single straight line will represent/model the relationship between those two data better, where “better” is defined as minimising the error of prediction.You can't put a better line that predicts one score from another through the numbers & minimises error. Hence, it's called
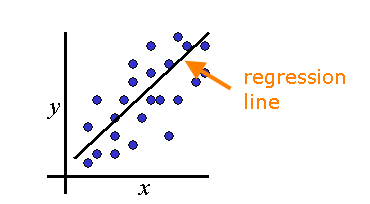
A LINE OF BEST FIT - 24How is the linear model displayed pictorially?
- 25What do the gaps between the data points and line represent in the previous diagram?The error of prediction or residual
- 26How is the line of best fit fitted?Its fitted to minimise the total amount of predictive error. if you added up all the prediction error (see diagram), the line of best fit is the line that results in the smaller possible number (of error). That's why it's called
LEAST SQUARES REGRESSION (least error) - 27Recap: what is the regression equation?The regression equation is the mathematical expression of the relationship between the two variables in question and the line of best fit.
- 28Write the regression equationY(predicted) = B(X) + C
- 29Define each of the components of the formulaY = predicted values of the outcome (first year uni psych)
B = the slope of the line
X = scores on the predictor (VCE Psych)
C = the intercept - 30What does predicted Y or Y hat look like when it's written mathematically? Hat represents 'predicted'

- 31What does Beta represent?The slope
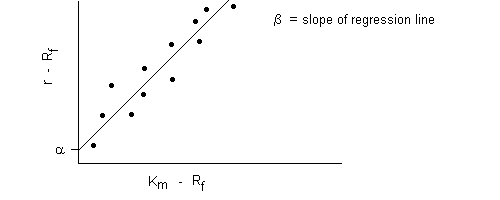
- 32What does C representThe intercept or the constant
- 33Write the formula using the lecture examplePredicted scores on first year uni psych = (slope of line)(VCE Psych) + intercept
- 34How do you run the equation in SPSS?1. Analyse
2. Regression
3. Linear
4. Add DV
5. Add IV
6. OK - 35Recap: what is SD?The standard deviation is a statistic that measures the dispersion of a dataset relative to its mean and is calculated as the square root of the variance
- 36Where are the important stats located for a regression? (R and R square)
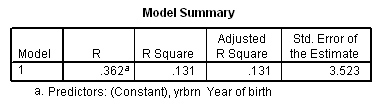
- 37What does the R represent?Pearson correlation but is written as a capital italicised R
- 38what does R2 represent?R square = R x R
Is the proportion of the variance in the dependent variable that is predictable from the independent variable
Example 43% shared variance. 43% of the variance in university scores is accounted by variation in VCE scores. - 39What's the difference between R square and adjusted R square?R square = the sample statistic
Adjusted R square (which is always lower) = the population estimate of R square (point estimate).
* R square commonly used - 40Provide an example of the ANOVA output related to regression
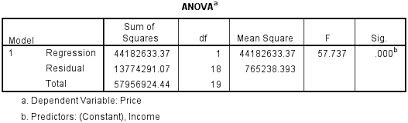
- 41What does the output tell us (using the lecture example)?If VCE psychology scores a significant predictor of university psychology scores
- 42What's the core hypothesis test in single regression?The ANOVA
- 43Where do we get the information to fill in the gaps in the regression model?
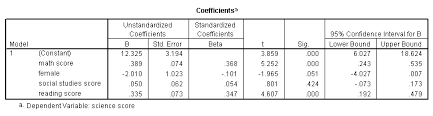
- 44What are the two crucial pieces of information needed for the regression formula, under the coefficient table ?1. Intercept/constant is under constant (26.86)
2. Beta which is the slope is under the variable (1.56) - 45What's another name for intercept?Constant
- 46What are the three core questions that we answer in a simple regression analysis?1. What are the R and R2 values that describe this relationship? (correlation stuff)
2. Is the relationship significant? Is VCE Psych a significant predictor of first year uni psych (ANOVA stuff)
3. What is the regression equation? (coefficient stuff) - 47Answer the three questions using the lecture output1. R = .66 (same as Pearson’s correlation) & R2 = .44
2. Use ANOVA to test significance:
F(1, 123) = 94.82, p < .001. - 48What is B (Beta)/the slope coefficient telling us?Every one unit increase in VCE scores is associated with a 1.56 unit increase in first year uni psych score
&
whether the Beta value is greater than zero (as tested by the ANOVA) . - 49What is ANOVA technically testing in this situation?Technically a test of whether the Beta value is greater than zero. The null hypothesis is the Beta = 0.
- 50What is intercept telling us?The intercept is the score that would be predicted for first year uni psych if you score zero in the VCE. Technically, it is where the regression line hits the Y axis.
- 51Why is it called a constant?Because the value is added to every score
- 52What can you do once you have the figures in the formula?Use the model to plug in any VCE score to obtain the predicted uni score
Example: 1.56(VCE Psych) +26.86
= 73.66 - 53When is the model perfect?When the data is a perfect straight line, which never happens.
- 54Recap: What are the actual scores? Predicted scores? Residuals? Scored Residuals?1. Actual scores: what people actually got.
2. Predicted scores: what the model predicts.
3. Residuals: the difference between the actual & predicted scores.
4. Sum of squared residuals: total amount of prediction error. - 55Where is the total amount of prediction error located?In the ANOVA table
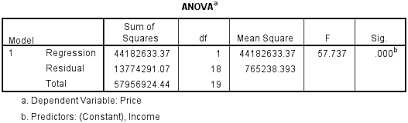
- 56How is the residual figure obtained?The difference between the model and the real data squared and added up
- 57How would you write this up?VCE Psychology scores were found to be a significant predictor of first year university psychology performance, R = .66, R2 = .44, F(1, 123) = 94.82, p < .001. The regression formula explaining the relationship was: Predicted first year uni Psych scores = 1.56(VCE Psychology score) + 26.86.
- 58Summarise the write upR
R2
F
Regression formula - 59Summarise the APA conventions related to the write up1. R - no leading zero, to two decimal places
2. F (2 df)
3. Present the regression formula - 60Can you use categorical variables for correlations and regression?Yes, however generally one have two groups otherwise special things have to be done. Need to know how they’re coded to interpret.
- 61What are the two main families of research?Research that looks for differences and modelling research which looks at relationships and patterns of relationships
- 62What's the line of best fit also called?Least squares regression
Information
- Description
- Flashcards on Lecture 10, created by Samar Castelli on 10/08/2018.
- Created by
- Samar Castelli
- Views
- 1
- Rating