
Flashcards
ligand binding
Cards in this deck (24)
- 1give 2 examples of protein ligand interactionsoestrogen receptor complexed with tamoxifen- a breast cancer drug
HMG coA reductase (cholesterol synthesis)
complexes with Lipitor
- this is the biggest selling drug of all time
- cholesterol lowering
blocks the first step on the pathway to cholesterol synthesis - 2What types of ligands do proteins interact with- Drugs
- Metabolites (typically less that 1000 D)
- Other proteins
- Lipids
- Complex carbohydrates
- Nucleic acids - 3what types of interactions take place between proteins and ligands- Van der waals
- Hydrogen bonds
- Salt bridges
- Hydrophobic interactions - 4what can be gleaned from binging studies- The strength of the interaction- by quantifying the binding affinity (Ka)
- Determine the stoichiometry- one protein/2 proteins?
- Determine the thermodynamic properties- enthalpy or entropy driven process - 5how can the information that is gleaned in binding studies be used in the drug development process- Candidate selection and optimisation - which of the ligands is the best
- Measure the active concentrations --> effective concentration? Need to understand the affinity to determine this
- Characterise the mechanism of action --> how does it work or inhibit
- Confirm the intended binding targets in small molecule drug discovery --> Know that it has an effect but not how
- Determine the binding specificity and stoichiometry
- Validation of IC50 and EC50 values during hit-to-leadThe EC50 is the concentration of a drug that gives half-maximal response. The IC50 is the concentration of an inhibitor where the response (or binding) is reduced by half.
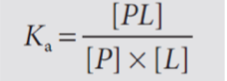
- Measurement of enzyme kinetics - 6define the Ka- Concentration of the complex divided by the protein concentration and the ligand concentration
- 7define the Kd- Concentration of the protein and the ligand divided by the complex
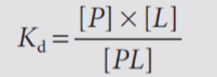
- 8what is the relationship between the Kaa and Kd1/Ka=Kd
1/Kd=Ka - 9relate the Ka or Kd to energy changes that are involved in the association/disassociation
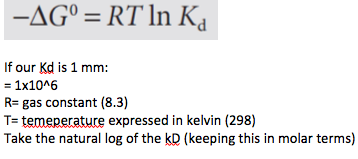
- 10what do ΔG values tell you about the complex formation in certain conditionlarge and positive number re suggesting that complex formation is favoured under the assumed conditions
- Small ΔG values are those under 5KJ - 11what can be shown by ligand binding saturation curves- Varying the ligand concentration and looking at the proportion of protein that is bound to the ligand
- Moving towards saturation- difficult to gather data across this extensive ligand concentration range
- Rather than gathering the data in this form we take the log of the ligand concentration and plot this against the percentage of protein that has ligand bound
- This produces a sigmoidal response - 12How do we determine if the protein is bound to the ligand- There are many biophysical techniques to establish ligand binding to the protein
- There are advantages and disadvantages to the use of all of these techniques - 13what are the advantages and disadvantages of ligand binding analysis using fluorescence- There is no special equipment that is required for this but the problem with this is a small dynamic range for looking at the range of concentrations that you may wish to cover
- 14what are the advantages and disadvantages of ligand binding analysis using circular dichroism- Change in the confirmation upon the binding of the protein and the ligand at the secondary or tertiary level. This can be detected by CD
- This is limited to a small dynamic range and is slow - 15what are the applications of CD- info on the secondary structure
information on the tertiary structure
information on integrity of protein confirmation following site directed mutagenesis
information on the stability of the protein
effect of the environment on protein structure
information on the confirmational changes following protein protein interactions and or following ligand binding - 16what are the drawbacks of using absorption ,Fluorescence and CDThese are all indirect methods that suggest that binding is taking place- alternatively direct methods may be used e.g. equilibrium dialysis and membrane filtration
- 17what the direct methods of ligand binding analysisEquilibrium dialysis
Isothermal Titration calorimetry
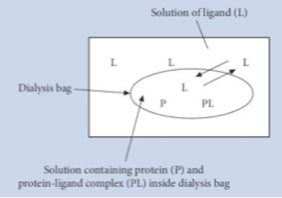
Surface plasmon resonance - 18what is Equilibrium dialysis- There is a piece of dialysis tubing in which the protein is place
- Known concentration of ligand on the outside of the tubing and allow the dialysis to occur
- Ligand moves into the dialysis tubing and if there is an interaction taking place, this will lead to a reduction in the external concentration of the ligand
- Binding can be calculated through a series of calculations - 19Equilibrium dialysis (diagrammatically)
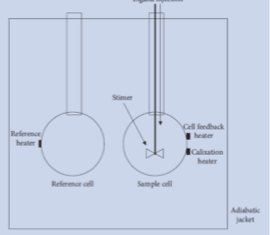
- 20what is isothermal titration calorimetry- Heavily insulated chamber
- In this there are 2 vessels- a control containing buffer and the reaction vessel where the protein is placed
- The ligand is injected into these
- If there is interaction there may be an associated change in the temperature that can be measured as a direct response of the breaking and formation of bonds
- Millionth of a degree c temperature changes
- Heavily insulated and control allows for these measurements to be made
- Relies on temperature change being detected- not always possible - 21how are the result of isothermal calorimetry (ITC) analysed- Take the area under each of the responses and plot this against the molar ratio (ratio of protein to ligand)
- From this you can deduce 3 things
1. Slope of the response shows the Ka (this can then be converted to the Kd
2. Height of the response shows the enthalpy change
3. Where the midpoint lies we can determines the stoichiometry
Values from this can then be used in a further calculation that is used to determine the entropy change and the gibbs free energy - 22isothermal calorimetry (ITC) (diagrammatically)
- 23what is surface plasmon resonance- There is a chip onto which protein is fixed
- Pass the ligand across the surface
- As the ligand binds there is a mass change
- This changes the angle that the light is detected by the detector
-->Detection of the mass change - 24Surface plasmon resonance -diagrammaticallySurface plasmon resonance
Information
- Description
- Protein structure and function Flashcards on ligand binding , created by Samantha bruce on 06/12/2019.
- Created by
- Samantha bruce
- Views
- 1
- Rating