
Flashcards
T-tests
Cards in this deck (41)
- 1Distributions
- 2Distributions Parametric stats:T-test, F-test, ANOVA…
…assume data follows a distribution function
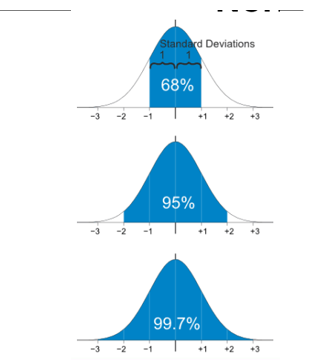
…e.g. normal (others available) - 3Normal distribution described by:Mean & Standard deviation
Area under curve = fraction of data in that range - 4Tests: Q-testtest for outliers
- 5Tests: F-testF-test = test for equality of variances
- 6Tests: T-testT-test = test for equality of means
- 7Tests χ2 test =χ2 test = test for distribution
- 8T-Tests: Conditions to use a T testmust be normally distributed
Remember: comparing means…
…means must be meaningful
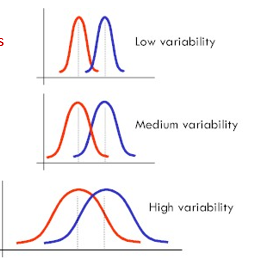
Straight visual comparison of means not viable
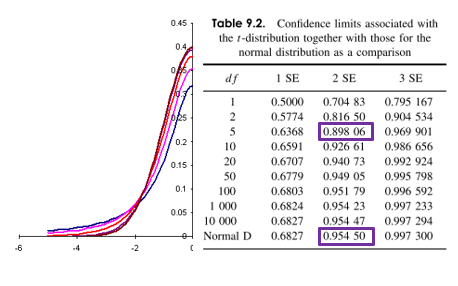
…variability must be accounted for - 9T-Tests: The t-DistributionThere is a penalty for not knowing population standard deviation.
Need to use the t-distribution
Tends towards normal for high n.
Higher tails than normal distribution
Recall that for normal dist…
at 2 σ, confidence limit = 95.5%
d.f. = degrees of freedom = n - 1
Confidence limit = lower for t-distribution - 10Confidence limit = lower for t-distribution
- 11T-Tests: Opportunities Parametric stats: T-test, …normal distribution Different types of t-test:two-sample independent, equal variances
two-sample independent, unequal variances
two-sample dependent, paired
one-sample
need to know which to use and when
Lots of opportunities, if you know how to take them - 12T-Tests: Independent, equal variances Three assumptions:1) The two populations have homogeneity of variances
2) The populations are normally distributed
3) Each value is sampled independently of each other.
#3 depends on your experiment.
3 samples from the same solution = independent
Sampling a response to a “before and after” treatment is unlikely to be independent. - 13T-Tests: Independent, equal variances low variability, medium variability and high variability
- 14T-Tests: Independent, equal variances Three assumptions:1) The two populations have homogeneity of variances
2) The populations are normally distributed
3) Each value is sampled independently of each other.
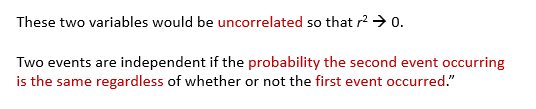
“Two variables are independent if the value of one variable does not provide information about the value of the other variable. - 15T-Tests: Independent, equal variances
- 16T-Tests: Independent, equal variances
- 17T-Tests: Independent, equal variances Welch’s t-test:
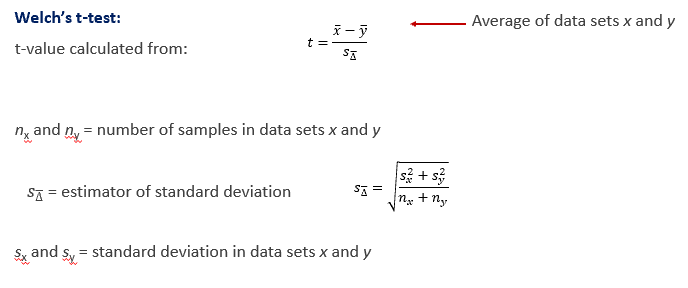
- 18T-Tests: Independent, unequal variances Three assumptions:1) The two populations have inhomogeneity of variances
2) The populations are normally distributed
3) Each value is sampled independently of each other. - 19How do you test for homogeneity of variances?A simple f-test
- 20T-Tests: Independent, unequal variances
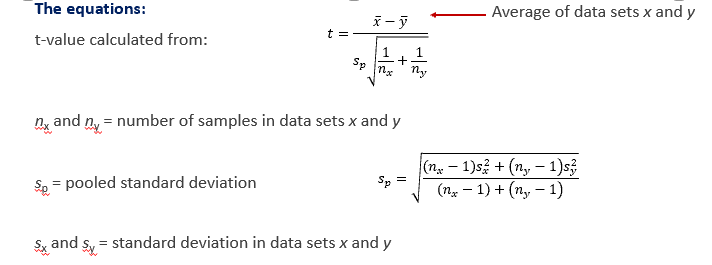
- 21T-Tests: paired samplesUsed when two measurements are taken from each sample in a study.
e.g. before and after studies, intervention studies - 22Scenario 1: Subject 64 students to a stats class. Feed half of them coffee and the other half mmmdonuts then measure their enjoyment of the class. Are the levels of enjoyment different?Need an independent t-test as the samples are not paired
- 23Scenario 2: Subject 64 students to a stats class. Feed them all coffee then measure their enjoyment of the class. Wait a week. Feed them all donuts then measure their enjoyment of the class. Is there a difference in enjoyment of the class after coffee or donutsNeed an paired t-test as the samples are paired – same subject, different treatment
- 24T-Tests: paired samples looking at differences
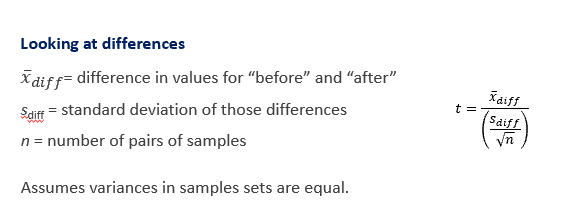
- 25T-Tests: Example 1 You work for a pharmaceutical company and your job is to test new drugs for possible side effects. The chemistry of drug GuarGM suggests that it may have the side effect of reducing the tendency toward obesity. The Esther rat is an established genetic model for both obesity and hypertension. As rats of the obese strain age they gain weight much more rapidly than do the so-called "lean" Esther strain. You plan to treat a group of animals over a period of one year and compare their average weight with that of a group of untreated animals. The odds of the drug actually showing this side effect are small and maintenance of rats for a year is expensive, so you limited the scope of the study to twelve animals in each group. The null hypothesis is that treated animals will show an average weight gain over one year that is no different from the average weight gain of untreated animals. What statistical test will you use to compare the two means?Independent t-test
No info on variance – need to test
The fact that there are 12 samples in each group is irrelevant – not the same rats so not dependent. - 26T-Tests: Example 2 The data from the study in Example 1 suggest that the drug GuarGM does affect weight gain, but it also proved effective and safe (so far) and is now in clinical trials. Because the drug was designed to treat symptoms that have nothing to do with obesity, the clinical trials do not focus on that problem and won't answer the question of whether or not the agent is a potential weight loss drug. The company, however, has permitted you to test the agent on a group of 12 people with morbid obesity. This time, the 12 obese individuals will be treated for a year, having measured their weights on the day treatment was started. The participants will monitor their weight whilst taking the drug, and are required to keep a daily log of activity and eating habits so that the experiment can be properly controlled. Nevertheless, the simplest initial test of the hypothesis that obese individuals treated with GuarGM for a year will show an average weight loss is to compare average weight at the beginning and end of the experiment. What statistical test will you use to compare thPaired t-test
The samples in the two data sets are dependent – it is the weight of an individual before and after giving the drug. - 27T-Tests: Example 3 A sample of n international students were given an English diagnostic test before studying their MSc and then again after completing their MSc. Does studying an MSc in the South-East of the U.K. improve their English grades? (p = 0.05) what type of t test?Dependent, paired t-test
- 28T-Tests: One-Tailed vs Two-tailed
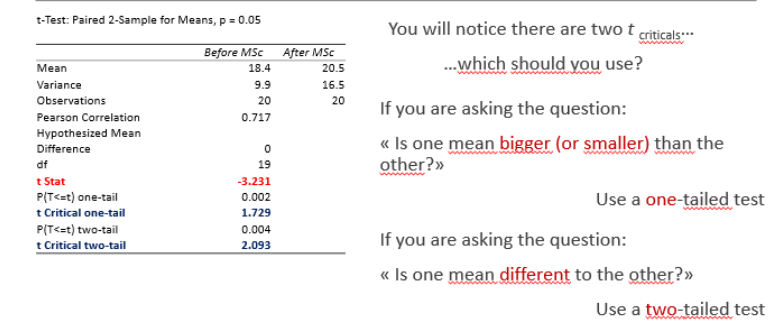
- 29T-Tests: Example 3
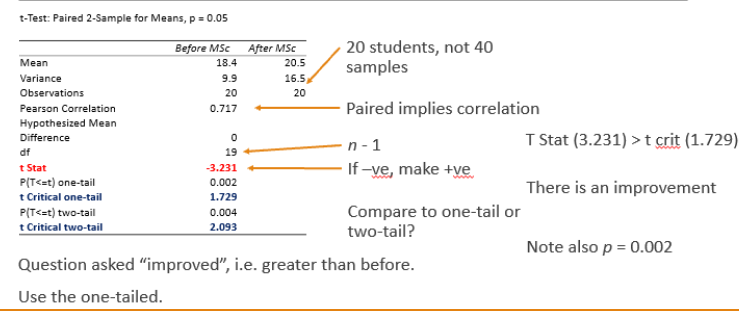
- 30T-Tests: Hypothesis TestingAll of this comparison of tcalc with tcritical (or the chosen p value with the calculated p ) is hypothesis testing
two opposing hypotheses:
-Null hypothesis: There is no difference between the means of two samples
-Alternative hypothesis: There is a difference between the means of two samples - 31T-Tests: Hypothesis TestingT-test determines whether you can reject the null hypothesis
If tStat > t crit then reject the null hypothesis ---> there is a difference in the means
If P (one of two tailed) < set probability ----> there is a difference in the means
p is kinda the probability of seeing a difference above random noise - 32T-Tests: Example 4Need an independent t-test – different samples, different labs
but first? Two sample F test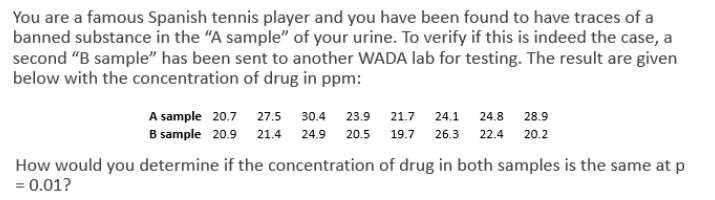
- 33T-Tests: Example 4 continuedF stat (2.070) < F crit (6.993)
Therefore, no significant difference in variances
Note also our test criterion (p = 0.01) is less than p (one tail) = 0.179 …
Corroborates the conclusion.
Proceed to an independent t-test assuming equal variances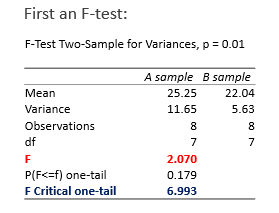
- 34T-Tests: Example 4Question asks for “difference” ----> use two-tailed values
t stat (2.186) < t crit 2-tail (2.977)
Therefore, no significant difference in means
Note also our test criterion (p = 0.01) is smaller than p (two tail) = 0.046.
Corroborates the conclusion.
We can say there is no difference in the means of drug concentration at p = 0.01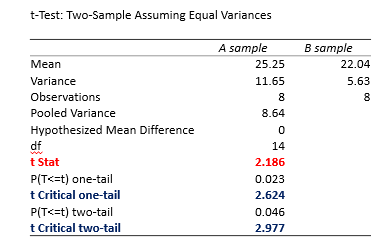
- 35P-values: Confidence?You generally do not see tstat & tcrit reported in lit
it is the calculated p value
n/s = no significant difference
* means p ≤ 0.05
** means p ≤ 0.01
*** means p ≤ 0.001
**** means p ≤ 0.0001
p is a measure of significance, the lower the value, the more significant the result
From previous example:
Note also our test criterion (p = 0.01) is smaller than p (two tail) = 0.046. - 36P-values: ConfidenceHow you interpret p values is fraught with danger
Proceed with extreme caution
“The p value is the probability that you would find a difference (by chance) as big as that observed, or a still bigger value, if in fact A and B were identical.”
(Colquhoun)
Does not tell you effect size, of likelihood of drawing wrong conclusion! - 37Summary 1) To know what a t-test doesIt tests for equality of means
- 38Summary 2) To know under what circumstances to use a t-testIf your data is normally distributed
- 39Summary 3) To understand the differences between types of t-testindependent vs dependent (paired) t-tests
- 40Summary 4) To apply one-tailed or two-tailed t-tests correctlyis the question “different” or “bigger”/“smaller”?
- 41Summary 5) To interpret t-tests correctly ...beware of taking the p (value literally)
Information
- Description
- Flashcards on T-tests, created by megan trent on 20/10/2020.
- Created by
- megan trent
- Views
- 0
- Rating