39519617
Description

Flashcards by Mrjiggles 17, updated more than 1 year ago
|
|
Created by Mrjiggles 17
over 1 year ago
|
|
| Question | Answer |
| Types of experiments | Laboratory - able to manipulate IV, in very controlled conditions Field - in a everyday setting (e.g.. the home), able to manipulate IV Natural - everyday setting, unable to change IV (e.g.. natural disasters) Quasi - controlled conditions, unable to manipulate IV (based on personal characteristics like age or sex) |
| Observation techniques | 3 pairs of 2 possible techniques for an observation: Naturalistic vs Controlled Covert vs Overt Participant vs Non-participant |
| Self report techniques | Questionnaires Interviews |
| Questionnaires | Open questions - person who answers writes their own answer (often gives qualitative data) Closed questions - a number of options given (often gives quantitative data) |
| Interviews | Structured - pre written out questions (gets better specific data) Unstructured - not written out questions, interviewer asks questions based on what they are talking about (can get better deep data) |
| Correlations | Co-variables - the two variables in a correlation test, neither is then IV or DV Correlations show relationship, not causation which experiments show |
| Aims | A general statement that describes what you are looking at in a study (e.g. to investigate weather music improves revision) |
| Hypotheses | A statement about what you think the outcome of a study will be 3 types: Directional (e.g. people who listen to music during revision will do better than those who don't in their exams) non-directional (e.g. people who listen to music during revision will get significantly different results than those who don't in their exams) null (e.g. people who listen to music during revision will get no significantly different result than those who don't in their exams) |
| Sample | You use a sample of the population as the total population is too large to be able to get data from everyone |
| How to get a sample | Random - randomly selecting from a list of the total population Systematic - selecting sample from population every X number (e.g. list of 100, every 5th person, you get 20 people) Stratified - picking people based on a characteristic, like from all of hills you selected a representative number of people from each secondary school they come from, a pre-study test would need to be conducted Opportunistic - taking the first X number of people you see Volunteer - asking for volunteers and using a number of those how volunteer for it |
| Experimental design | Repeated measures - All participants are used in every IV Independent groups - splitting the group into small groups, each smaller group does their own IV matched pairs - you do a pre-study test, pair up the people in the results and then put each person of each pair into opposite groups for the experiment, each group does a different IV |
| Experimental controls | Random allocation - independent groups, the people in each smaller group is randomly selected Counterbalancing - repeated measures, changing order of events to some participant variables Standardisation - making a step by step guide of what should happen during the experiment, so it is the same for everyone |
| Ethics | British psychological society has a set of instructions for experimenters to keep studies ethical The main points are: informed consent, limited deception, protection from harm, and privacy and confidentiality of participants There are cases to be made about occasional violations, but there are many ways to mitigate the risk of each of them |
| Types of data | Quantitative - numerical data - counting behaviours Qualitative - non-numerical data - extract from an interview, photos, drawings Primary - data gathered first hand Secondary - data gathered by someone else in a different study |
| Use of secondary data | Secondary data is used in meta-analyses (quantitative) and meta-reviews (qualitative) In these, you take many different but similar studies to come to a greater conclusion on what they are trying to study |
| Measures of central tendency - descriptive statistics | Mode - most common number Median - middle number Mean - average of the data (add all numbers and divide by the number of numbers) |
| Deviation from central tendency - descriptive data | Range - the difference between the biggest and smallest piece of data Standard deviation - the amount 68% (1 stdev) of data is away from the mean (95% = 2 stdev) |
| Data presentation | 2 main types: Tables Graphs |
| Graphs | 3 main types used: Scatter graphs - used for correlation data, and calculating correlation coefficients to find relationships Bar chart - used for discreet experimental data Histogram - used for continuous experimental data |
| Distributions | 3 types: Normal distribution Skewed left (positively) distribution Skewed right (negatively) distribution |
| Variables (types) | Independent - what the experimenter changes Dependant - what the experimenter collects Extraneous - variables identified at the start the experimenter controls for Confounding - variables that were not controlled for and were not tested for that changed the data |
| How do you find what you need to collect for a variable? | Operationalisation - taking a characteristic, e.g.. anger, and turning it into something you can collect as data |
| How do you stop extraneous variables? | Controlling - doing something that either takes away or takes into account a variable you are not testing for before the experiment |
| Personal effects on the data | Participant effects - characteristics of each person that can change how they respond in an experiment Demand characteristics - if a participant learns the purpose of the study, they can chose to either give the expected response or the opposite response, which could skew the data Investigator effects - actions by the researcher which influence the participants in a way not planned for, reduced using standardisation |
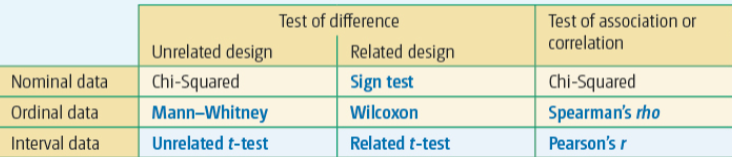
| What statistical test to use | |
| How to do the sign test | Must only be used in a related design experiment (e.g. repeated measures) You take the 2nd test away from the 1st and record if it is positive, negative, or neutral/no different (the sum = 0) Count all those that are positive, and all those that are negative, the smaller value of the two is what you use for your calculated value/the S value Then using the critical value table, go down the 0.05 column on the type of hypothesis you are using for the number of participants that had a difference in their data (IE positive + negatives), that number is the critical value Then compare the calculated and critical value, if the calculated value is lower than critical, the data you have collected is significant at P=.0,05, the standard for psychology |
| Economics | Psychological research can be good and bad for the economy For example, the role of the father research could show that fathers should get time off work, therefore reducing the economic gain of that family, therefor reducing economic activity and therefore slowing down economic growth |
| Case studies | A full scale study into 1 specific group/person/event/thing. Often an unusual thing, e.g. a person with a specific rare disorder. Often takes place over a long period of time. Mostly qualitative data, sometimes quantitative. |
| Pilot studies | A study done before the main investigation one. Done to find if there needs to be changes before the study, e.g. number of participants, experimental design, more controls. |
| Observational design - ways of recording data | Unstructured observations - the researcher just write down everything that happens. Structured observations - the researcher takes a tally of specific things decided before the observation. |
| Observational design - behavioural categories | An operationalised list of what actions shows the characteristics the observation is looking for. e.g. affection -> kissing, hugging, etc. |
| Observational design - sampling methods | Event sampling - counting the number of times a specific action happens. Time sampling - noting down behaviours every set of time (e.g. every 30 seconds). |
| Levels of mesurement | Nominal - category data (e.g. improved, got worse, stayed the same) Ordinal - ranked data (e.g. 1st, 2nd, 3rd in a race) Interval - standardised measurements (e.g. time, cm, mm, meters) |
| Content analysis | Observational research, studying people indirectly through their communications. e.g.. through their speech, emails, media watched/read. |
| Coding | Turning qualitative data into quantitative data. done by breaking down a large chunk of text into smaller parts, typically by counting how many times a word or phrase is used. |
| Thematic analysis | Identifying themes in text to make it easier to analysis for research purposes. themes are repeated ideas, explicit or implicit, throughout the text. |
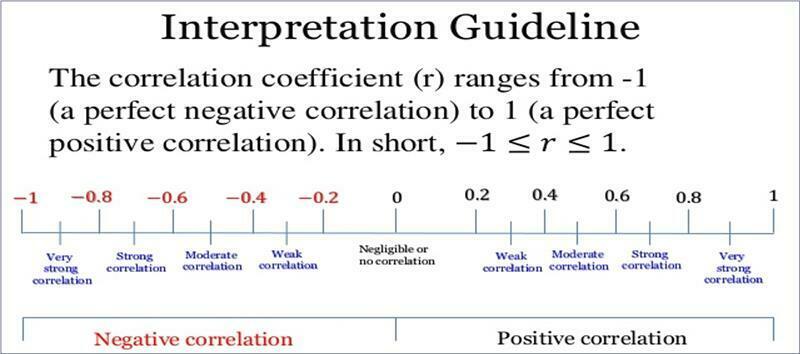
| Correlation coeficients | A measurement of how closely related two co-variables are in terms of a relationship. Easily seen by how tight around a line data points are on a scattergram. |
| Interpretation of correlations | |
| Using statistical tables and interpreting significance from it | First determine if your hypothesis is one or two tailed. Then calculate the degrees of freedom. Then using those two pieces of information, at P<0.05, find where they intersect on the table for your statistical test. |
| Type 1 errors | When you reject the null hypothesis and accept the alternative hypothesis, when you should have done it the other way round. creating a false positive in the data set. |
| Type 2 errors | When you accept the null hypothesis and reject the alternative hypothesis, when you should have done it the other way round. creative a false negative in the data set. |
| Test-retest | repeating an experiment, then comparing the data, if similar enough (>0.8 correlation coefficient), then it improves the reliability of the data. |
| Inter-rater reliability | During an observation, having two (or more) researchers using the same behavioural categories and observing the same thing at the same time, then comparing the results. If the corelation coefficient is above 0.8 then it improves the reliability of the data. |
| Improving reliability | reducing ambiguousness or leading questions, standardisation, operationalisation |
| Types of validity | Internal validity - whether the difference found was due to the IV changing or something else. External validity - how easily the data can be generalised to real life. temporal validity - if the findings of a study or a concept hold true over over time, or weather it was a product of a particular time. |
| Assessing validity | face validity - if just by looking at it, the data makes sense and the method measures what it needed to measure. Concurrent validity - if there is agreement between a new method of data collection and an old proven to work one. |
| Improving validity | Control groups, single/double blind, standardisation, lie scales, anonymous responses, covert observations, defined behavioural categories, triangulation |
| Features of science - objectivity and the empirical method | Objectivity: how far the data was effected by personal effects, but the researcher or the participants in the study. EM: collecting data based on observable facts and direct experience |
| Features of science - replicability and falsifiability | Replicability: the extent to which you can repeat the exact same method and get the same results Falsifiability: the principle that you can only prove something false, so if you cannot do that the theory is not scientific. |
| Features of science - theory construction and hypothesis testing | TC: developing an explanation for behaviour by systematically collecting data and using it to improve the theory. HT: using a theory to produce testable statements, which then can be used to falsify the theory. |
| Features of science - paradigms and paradigm shifts | Paradigm: a shared set of assumptions within a scientific discipline. PS: when the shared set of assumptions changes over time due to a new discovery. |
| Scientific reports - abstract and introduction | Abstract: a short summary of the whole report (150-200 words) Intro: setting out the aim and hypothesis of the investigation, and using past studies in a literature review to show what the study is about. |
| Scientific reports - method and results | Method: setting exact exactly what you did, the design, sample, materials, procedure, and ethics of the study. Results: the descriptive and inferential statistics of a report, or the thematic analysis of a qualitative data set |
| Scientific reports - discussion and referencing | Discussion: a verbal summarisation of the findings rather than statistically. then suggesting what it means for psychology. Referencing: citing the sources you used throughout the report, like older studies. |
| Statistical tests - Mann-Whitney and Wilcoxon | (MW) When: Ordinal, unrelated data, difference (MW) Looking for: calculated value is less than the critical value (WI) When: Ordinal data, related data, difference (WI) Looking for: calculated value is less than the critical value |
| Statistical tests - Spearman's Rho and Pearson's R | (SR) When: ordinal data, relationship (SR) Looking for: Calculated value is more than the critical value (PR) When: interval data, relationship (PR) Looking for: Calculated value is more than the critical value |
| Statistical tests - Unrelated and related T-tests | (UT) When: interval, unrelated data, test of difference (UT) Looking for: calculated value is more than critical value (RT) When: interval, related data, test of difference (RT) Looking for: calculated value is more than critical value |
| Statistical tests - chi^2 | When: Nominal, unrelated data, test of difference (or association) Looking for: calculated value is more than critical value |
Want to create your own Flashcards for free with GoConqr? Learn more.