
Flashcards
Maths Unit 1
Cards in this deck (5)
- 1MathsUNIT 1
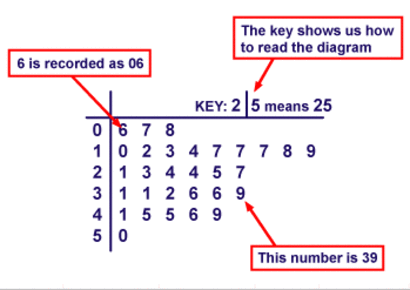
- 2Stem and Leaf Diagram
- 3Scatter GraphsScatter diagrams are used to represent and compare two sets of data. By looking at a scatter diagram, we can see whether there is any connection (correlation) between the two sets of data.
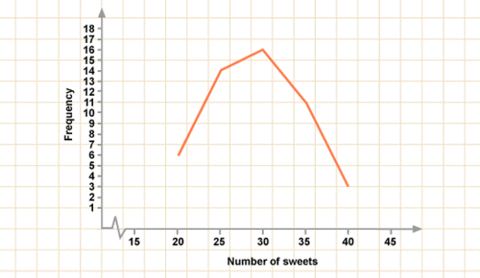
- 4Frequency PolygonsFrequency polygons can be used to represent grouped data
- 5Eg: Number of sweets Frequency 18-22 6 23-27 14 28-32 16 33-37 11 38-42 3
Information
- Description
- Flashcards on Maths Unit 1, created by ninabellx on 23/12/2013.
- Created by
- ninabellx
- Views
- 17
- Rating