
Flashcards
MGTS3206
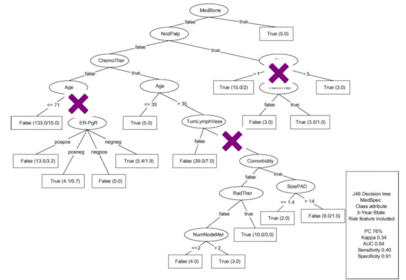
Cards in this deck (44)
- 1MGTS3206 Lecture 1 Data Scientistdo actual modelling
statistician - 2Modelrepresentation of reality
- 3Predictive model Prediction InstancePM - formula estimating unknown value of interest
P - estimate an unknown value
I - represents a fact or data point - 4Classification example Regression Similarity Matching Clustering Data ReductionC - how likely is consumer to respond
R - how much will she use the service
SM - can find consumers similar?
C - do my customers form groups
DR - which latent dimensions describe taste preference - 5Co-occurrence Grouping Profiling Link Prediction Causal modelingCG- association rule, basket analysis
P - normal behavior look like
LP - John and Jane share friends should they become friends
Causal Modeling - why are consumers leaving - 6Supervised Methodsclassification
regression
causal modeling
similarity matching
link prediction
data reduction - 7Classification RegressionC - categorical target often binary (class probability estimation)
R - numeric target - 8“Will this customer purchase service“How much will this customer use the service?”
Regression problem
- Numeric target
- Target variable: amount of usage per customer - 9Summary of bad habitsmissing all the application
sick people came from a very artificial subset
target is not target
no way of telling how the model will perform or test it - 10Expected Value of InformationFirst how to handle continuous probability distribution
Second, what happen when there are many uncertain events and information is available about some or all of them
Evaluate decision option with and without the information, and find the difference in the EMV - 11Value of informationsensitivity analysis, structuring
1. tornado diagram
2. Perform sensitivity analysis
3. Probabilistic model - 12Splitting criterioninformation gain (purity measure called entropy)
- 13Tree structure rulesNo two parents share descendants
no cycles
branches always down
always end up at a lead node with class determination - 14Classification problemtarget takes on discrete values that are NOT ordered
binary classification where target is either 0 or 1 - 15Solutions to classificationclassifier model
Binary: Ranking, Probability estimation - 16PruningPost-pruning (fully grown cuts unreliable parts)
Pre pruning
Post pruning is preferred - 17Decision pruning
- 18Classification functionIf 1 * Age - 1.5 * Balance + 60 > 0
- 19Best line of fitobjective function should represent our goal
- 20Distinction between classification and regression is if target variable is categorical or numeric (Logistic regression produces numeric estimates (values in the target variable are categorical)Logistic regression is a class probability estimation model not a regression model
- 21SVM Support vector machinesUSe hinge loss - example that is not on the wrong side of the margin (hinge loss only positive when an example is on the wrong side)
- 22Zero-one loss Squared errorZOL - assigns loss of zero for correct decision and one for incorrect decision
SE - specifies a loss proportional to the square of the distance from the boundary - 23Ranking Class Probability EstimationR - Tree induction
R - Linear discriminant functions (Linear regressions, Logistic regressions, SVM)
CPE - tree induction, Logistic regression - 24Linear model vs Tree InductionSmooth modelling
non-linear
how much data - 25Panel Data analysisimportance of fixed and random effects
Hausman test (fixed and random effects) - 26Panel datacross sectional unit and time series
- 27Panel data use- explicit account of individual specific heterogeneity
- more data variation
- dynamics of change
0 detecting and measuring
study of more complex behavioral models - 28Fixed effect and random effectLarge and small N likely to be little difference so FE
Large n and small t estimates differ significantly (cross-sectional groups are random) RE
if error component v correlates with x then RE is biased and FE is not
For Large N and small T and assumptions behind RE - 29Hausman Testtest difference between coefficient estimates obtained by FE and RE then null hypothesis that the RE estimates are efficient and consistent and FE estimates are inefficient
- 30Lecture 5 Model Performance AnalysisOverfitting data (chance patterns that do not generalize is over-fitting)
- 31Over-fittingmodel memorizes the properties of the particular training set rather than learning the underlying concept or phenomenon
- 32Holdout validationGeneralization - holdout set for final evaluation is test set
- 33Holdout evaluation to cross validationstatistics on estimated performance
better use of a limited data set (cross validation computes its estimates over all the data) - 34Generalization performancemodelling procedures difference
different training sets
different test sets
different test sets different estimates
training set size - 35Logistic regression vs Tree inductionsmaller training set = logistic regression
classification trees are more flexible model
flexibility of tree induction can be advantage with larger training sets - 36Learning curve show generalization performance plotted against amount of training data usedfitting graph shows the generalization performance as well as the performance on the training data but plotted against model complexity
- 37Avoiding over-fittingpost pruning
pre pruning
Linear models - feature selection, regularization (optimize some combination of fit and simplicity) - 38Nearal Networks for Data Mining (applicationstarget customer
bank loan
hiring
stock purchase
trading electricity - 39ANN
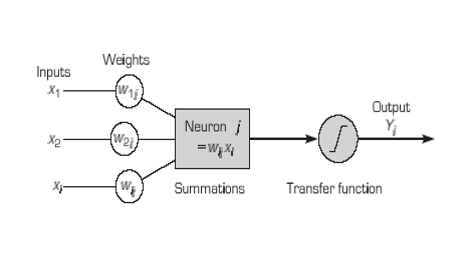
- 40Backpropagationlearning alogrithm - comparing computed outputs to desired outputs of historical cases
Network Structure - (input intermediate (hidden) (output) - 41Loan Processing Example Inputs – income level, age, home ownership nodes Outputs – approval/disapproval of loan nodesConnection weights
The weight associated with each link in a neural network model
strength of the data transferred between layers in the network
They are assessed by neural networks learning algorithms - 42Threshold value is sometimes used instead of a transformation function A hurdle value for the output of a neuron to trigger the next level of neurons. If an output value is smaller than the threshold value, it will not be passed to the next level of neuronsData collection and preparation
The data used for training and testing must include all the attributes that are useful for solving the problem
Recall the bankruptcy prediction problem we modeled using logistic regression -- The same data can be used to train a neural network:
working capital/total assets (WC/TA)
retained earnings/total assets (RE/TA)
earnings before interest and taxes/total assets (EBIT/TA)
market value of equity/total debt (MVE/TD)
sales/total assets (S/TA) - 43Implementing an ANNrequires interfaces with other IS
monitoring and feedback
confidence of users and management in early deployment - 44—
Information
- Description
- Flashcards on MGTS3206, created by joel_clement34 on 14/04/2016.
- Created by
- joel_clement34 · Apr 2016
- Updated
- Apr 22, 2016
- Views
- 0
- Rating