
Flashcards
BA Module 2
Cards in this deck (32)
- 1What is the difference between numerical properties of a population and those of a sample?In the previous module, we learned about descriptive statistics. The numerical properties of a population are called parameters and those of a sample are called statistics. A statistic is an estimate of a true value of a parameter. If a sample is sufficiently large and is representative of the population, the sample statistics should be reasonably good estimates of the population parameters.
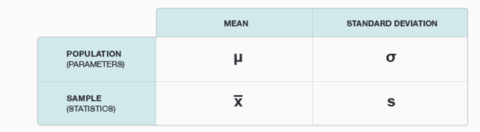
- 2Differentiate between population and sample measures.To differentiate between population and sample measures, we use the Greek alphabet for population parameters, and the Latin alphabet for sample statistics. The symbols for the mean and standard deviation are summarized in the table below.
- 3How do you use the RAND function in Excel?Suppose we have the phone numbers of 20,000 people, and we want to survey a random sample of 100 of them. We will do this using Excel’s RAND function. RAND assigns a random identification (ID) number between 0 and 1 to each data point—in this case, to each phone number. We use these random ID numbers to sort the data, creating a list of the phone numbers in “random” order. We then call the first 100 numbers on the list.
The Excel formula requires that we simply type the formula with closed parentheses.
We can use the RAND function to generate random numbers between any two specified values. For example, if we wanted to generate random numbers between 0 and 10 we would multiply the function by 10 and enter =RAND()*10. If we wanted numbers between 5 and 15, we would enter =5+RAND()*10. - 4Talk very briefly about statistical significance as it relates to AMZNWhen we're deciding on the right sample size, we use statistics to figure out the smallest sample at the right frequency to ensure statistical significance of the results.
- 5Give an example of a biased question in samplingThe following are biased questions:
Most new car owners purchased an extended warranty from the dealership. Are you going to buy one?
Should we have stricter gun laws to prevent school shootings?
Childhood obesity is on the rise. Do you think kids spend too many hours playing computer games?
Secondhand smoke can cause cancer. Should we ban smoking from restaurants and other public spaces?
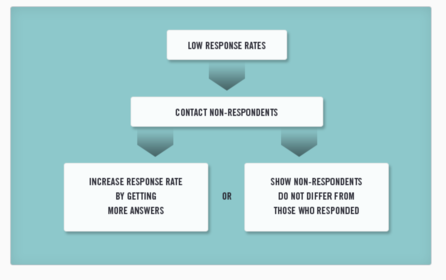
Underage drinking is okay, right? - 6Briefly discuss representation of populations and response rates.If we do not represent a segment of the population, then our sample is not representative of the population. If resources are limited, it is often better to take a small sample and relentlessly pursue a high response rate than to take a larger sample and settle for a low response rate. If we have a low response rate, we should contact non-respondents and try to either increase the response rate or demonstrate that the non-respondents’ answers do not differ from the respondents’ answers.
- 7What are some rules of thumb to keep in mind regarding normal distribution curves?Regardless of the location or width of the curve, it always retains its bell-shape form.
Based on its unique shape, we can create a few rules of thumb for normal distribution.
For example, about 68% of the probability of a normal distribution is contained in the range reaching from one standard deviation below its mean to one standard deviation above its mean.
If we go two standard deviations away from the mean, we'll capture about 95% of the probability.
And if we go three standard deviations,
we'll cover about 99.7% of the probability. - 8Rules of thumb for normal distribution:Rules of thumb for the normal distribution:
About 68% of the probability is contained in the range reaching one standard deviation away from the mean on either side:
P(μ−σ ≤ x ≤ μ+σ)≈68%
About 95% of the probability is contained in the range reaching two standard deviations (1.96 to be exact) away from the mean on either side:
P(μ−2σ ≤ x ≤ μ+2σ) ≈ 95%
We’ll use two standard deviations when discussing the normal distribution conceptually, but we will always use 1.96 for actual calculations in Excel.
About 99.7% of the probability is contained in the range reaching three standard deviations away from the mean on either side:
P(μ−3σ ≤ x ≤ μ+3σ) ≈ 99.7% - 9The sample mean is just a single point called _____The point estimate
- 10What is the normal distribution?The normal distribution is a probability distribution that is centered at its mean.
It's often referred to as a bell curve
due to its bell-like shape.
Like any probability distribution,
the normal distribution is shown on two axes.
On the horizontal or "x" axis is the variable we're studying, and on the vertical or "y" axis is the likelihood
that different values of that variable will occur. - 11What is the standard normal curve?The standard normal curve is a normal distribution whose mean is equal to zero (μ=0), and whose standard deviation is equal to one (σ=1).
- 12Because the normal distribution is a continuous probability distribution, the probability of the normal distribution equaling any particular value is zero. True or False?Because the normal distribution is a continuous probability distribution, the probability of the normal distribution equaling any particular value is zero (this is why we only assess the probability of a range for a continuous distribution). Because of this, we can use the terms “less than” and “less than or equal to” interchangeably when calculating probabilities for continuous distributions. Likewise we can use the terms “greater than” and “greater than or equal to” interchangeably. For example, because we know that the probability of the normal distribution equaling its mean exactly is zero, P(x=μ)=0, we can say 50% of the probability is less than the mean or 50% of the probability is less than or equal to mean: P(x<μ) = P(x≤μ)=50%.
- 13What is cumulative probability?The probability of all values less than or equal to a particular value is called a cumulative probability. Note that cumulative probabilities are conceptually related to the percentiles of a distribution. For example, the value associated with a cumulative probability of 90% is the 90th percentile of the distribution.
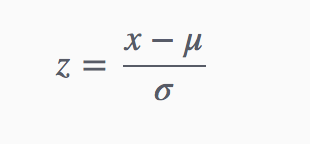
- 14What is the formula for calculating z values?The lower scale references those same locations on the standard normal curve, which is often easier to work with. These standardized values are known as z-values. The z-values for any normal distribution can be calculated using the formula above
- 15What is the opposite of the NORM.DIST() function?NORM.INV
Sometimes we want to do the opposite of what we’ve just learned. That is, instead of starting with a value on a normal curve and finding the cumulative probability associated with it, we may start with a cumulative probability and wish to find the corresponding value on a normal curve. For example, we may want to find the value associated with the cumulative probability 99% for the distribution of women’s heights. In other words we might want to know the 99th percentile of women’s heights. - 16What is the difference between PERCENTILE.INC and NORM.INV()In the previous module we learned to use the Excel function PERCENTILE.INC for a discrete set of numbers. We cannot use the PERCENTILE.INC function for a normal curve, since the normal distribution’s values are not restricted to a discrete set of numbers. For a normal distribution, we can use Excel’s NORM.INV function to calculate a given percentile. The “INV” indicates that this function calculates the inverse of the cumulative probability.
- 17Suppose we want to calculate the value associated with the upper tail of a distribution, that is, the probability of an outcome greater than a specified value.Suppose we want to calculate the value associated with the upper tail of a distribution, that is, the probability of an outcome greater than a specified value. We first need to calculate the value associated with the corresponding cumulative probability, which is one minus the probability of the upper tail. For example, the height that 1% of women are taller than is the same as the height that 99% of women are shorter than. Thus we calculate the value associated with the top 1% by entering the function =NORM.INV(0.99,63.5,2.5)≈69.
- 18What if we want to find a range of values associated with a probability that is not a cumulative probability? For example, suppose we want to know the range of values associated with the “middle” 99% of a normal distribution?The Excel functions we’ve studied for the normal distribution can be used only for cumulative probabilities. What if we want to find a range of values associated with a probability that is not a cumulative probability? For example, suppose we want to know the range of values associated with the “middle” 99% of a normal distribution? The normal curve is symmetrical, so we know that the middle 99% of the distribution comprises 49.5% on either side of the mean and excludes 0.5% on each of the tails. Thus we can find the value corresponding to the left side of the range using the NORM.INV function evaluated at 0.5% and the right side using the NORM.INV function evaluated at 99.5%. In this case, the values associated with the middle 99% are NORM.INV(0.005,63.5,2.5)=57.1 and NORM.INV(0.995,63.5,2.5)=69.9.
- 19What does the Central Limit Theorem say?The central limit theorem says
that if we take many random samples from a population
and plot the means of each sample,
then, assuming the samples we take are sufficiently large,
the resulting plot of the sample means
will look normally distributed.
Furthermore, if we take enough of these samples,
the average of the sample means
will be equal to the true mean of the population. - 20How does the distribution of sample means differ from the distribution of the population?The most important difference is that the two distributions have different standard deviations.
- 21Larger samples will result in a more narrow distribution of sample means. Discuss.Since the width of the distribution of sample means is affected by the sample size, larger samples will result
in a more narrow distribution of sample means.
This should reinforce our intuition because we know that the larger the sample size,
the more accurately the sample mean
approximates the population mean.
Thus, for larger samples,
the resulting distribution of sample means
will be more closely clustered around the population mean. - 22What is one reason why the central limit theorem is a powerful tool?The central limit theorem is a powerful tool for sampling an estimation because it allows us to ignore the underlying distribution of the population we want to learn about.
We now know that the mean of a sample is part of a normal distribution.
Specifically, we know that the sample mean falls somewhere in a normal distribution that is centered at the true population mean.
Because of this, we can completely disregard the underlying distribution of the population and focus only on the sample. - 23What is the mean of the standard normal curve?0
- 24How do you calculate the standard deviation of the Distribution of Sample Means?The standard deviation of the Distribution of Sample Means equals the standard deviation of the population distribution divided by the square root of the sample size. Thus, increasing the sample size decreases the width of the Distribution of Sample Means.
- 25How do you calculate the standard deviation of the Distribution of Sample Means?The standard deviation of the Distribution of Sample Means equals the standard deviation of the population distribution divided by the square root of the sample size. Thus, increasing the sample size decreases the width of the Distribution of Sample Means.
- 26What does a confidence interval depend on?A confidence interval depends on the sample’s mean, standard deviation, and sample size. As we’ll see, a confidence interval also depends on how “confident” we would like to be that the range contains the true mean of the population. For example, if our sample mean is 50, we might calculate a 95% confidence interval from 42 to 58. We can be 95% confident that our interval contains the true population mean.
- 27How should a 95% confidence level be interpreted?A 95% confidence level should be interpreted as saying that if we took 100 samples from a population and created a 95% confidence interval for each sample, on average 95 of the 100 confidence intervals (that is, 95%) would contain the true population mean.
- 28What is the relationship between confidence levels and confidence intervals?What if we wish to construct an interval based on a level of confidence other than 95%? Higher levels of confidence require wider confidence intervals that have a higher likelihood of containing the true population mean; lower levels of confidence require narrower confidence intervals. For example, a 68% confidence interval would be approximately half the width of a 95% confidence interval; its width is only one times the standard deviation of the distribution of sample means.
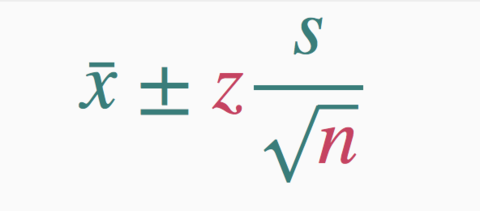
- 29What is the equation for the confidence interval margin of error?However, since we rarely know the standard deviation of the underlying population, σ, we will substitute our best estimate of σ, which is the sample standard deviation, s. The term, is often referred to as the confidence interval’s “margin of error.”
- 30Name 2 factors that would increase the width of the confidence interval1. Increasing the confidence level
2. Decreasing the sample size - 31Suppose that you have a sample with a mean of 50. You construct a 95% confidence interval and find that the lower and upper bounds are 42 and 58. What does this 95% confidence interval around the sample mean indicate?We are 95% confident that the population mean lies between 42 and 58.
is correct
The 95% confidence interval is a range around the sample mean. We can say that we are 95% confident that the true population mean is within this range, based on the methods we used to calculate the range. If we were to construct similar intervals for 100 samples drawn from this population, on average 95 of the intervals will contain the true population mean. - 32—
Information
- Description
- Business/Economics Flashcards on BA Module 2, created by Sola So on 08/08/2016.
- Created by
- Sola So
- Views
- 0
- Rating