
866718
| Question | Answer |
| Nominal or categorical variable | Numbers = Discrete categories Numbers don't signify higher or lower. Correlations can not be done with this type of data, unless it is dichotomous, such as, gender. |
| Ordinal data | order or rank. These do signify high or low. Differences between ranks are not equivalent. Can do phi correlations, can't do pearsons correlations. |
| Interval, or continuous data | Most common in Psychology, e.g., Likert scale. Note; singular Likert scale data is ordinal but when data is multiplied and combined then it becomes continuous. Ratings are more sensitive than rankings. However, rankings can be easier to do. |
| Ratio | interval scale with a zero point, e.g., height, weight, etc. Psychology does not use this much. |
| Categorical data is good for? | Frequencies within the data, i.e., the numbers of individuals within each group. Can use then as an IV in an analysis of variance (ANOVA, MANOVA), can do a chi square. You can't generate a mean with categorical data. |
| Ordinal Data good for? | It is a mixture of both categorical and interval data. Usually just reporting the rank ordering |
| Continuous data good for? | It is the most flexible data for quantitative analysis. You can derive a mean and a standard deviation. Can do correlations, t-tests, ANOVAs |
| Making sense of data requires; Description | Descriptive statistics, what the data looks like. This is where you report where the distributions of your data are. No hypotheses should be mentioned. |
| Making sense of data requires; Analysis | Inferential Statistics. What the data is referring to about the hypotheses. |
| How to present frequency distributions | Graphs such as bar graphs and pie graphs are good for presenting frequency distributions. |
| Discriptive statistics with interval data | Mean, Median, Mode (measures of central tendency). |
|
Image:
Picture1 (image/png)
|
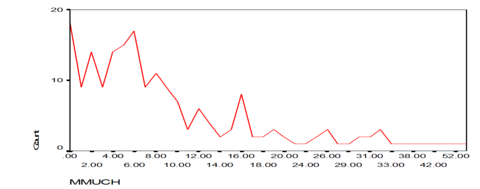
Positive skew. Normally occurs when asking about things which occur rarely, e.g., how often do you kill people. |
| Negative Skew | When the data is bunched to the right. Usually occurs when there is something that happens often, e.g., how often do you smile |
| Skews are ___ for analysis of variance | Bad for analysis of variance. Normal distributions are better |
| Variability is? | How much the score varies around the mean, ST is the average variance away from teh mean, this is essential for discriptive and inferential statistics. |
0 comments
Want to create your own Flashcards for free with GoConqr? Learn more.