
Mind map
REPRESENTACIONES GRÁFICAS
Map content
REPRESENTACIONES GRÁFICAS
Adaptar contenido o iformación
ver el comportamiento de la muestra donde se está realizando el estudio
representaciones visuales complementarias de las tablasque resumen datos
Tipos:
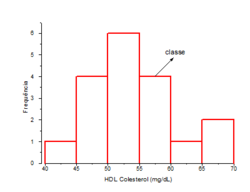
- H I S T O G R A M A
- Variables cuantitativas continuas o discretas
- en el eje vertical = frecuencias/ eje horizontal = clases
- en el eje vertical = frecuencias/ eje horizontal = clases
- Variables cuantitativas continuas o discretas
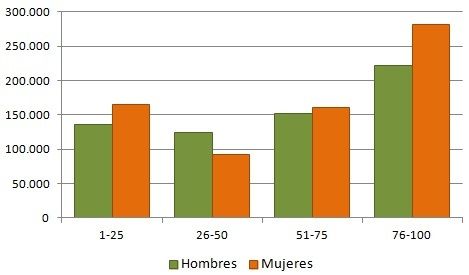
- D I A G R A M A DE B A R R A S
- Variables cuantitativas discretas
- Variables cuantitativas discretas
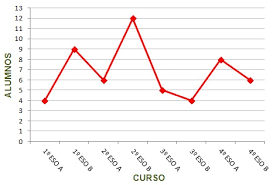
- P O L Í G O N O DE FRECUENCIAS
- Variables cuantitativas discretas o continuas
- Variables cuantitativas discretas o continuas
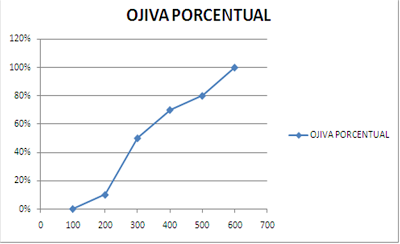
- OJIVA PORCENTUAL
- rango porcentual del valor en una distribución de frecencias
- rango porcentual del valor en una distribución de frecencias
- H I S T O G R A M A
Images and files in the map
Information
- Description
- MANCILLA LOPEZ ALEJANDRO BAUTISTA GARCIA FERNANDA ROJAS HERNANDEZ ALEJANDRO HUERTA VEGA MARIA FERNANDA VEGA GONZALEZ DENISE
- Created by
- DENISE VEGA
- Views
- 49
- Rating