
Mind map
Regression Analysis
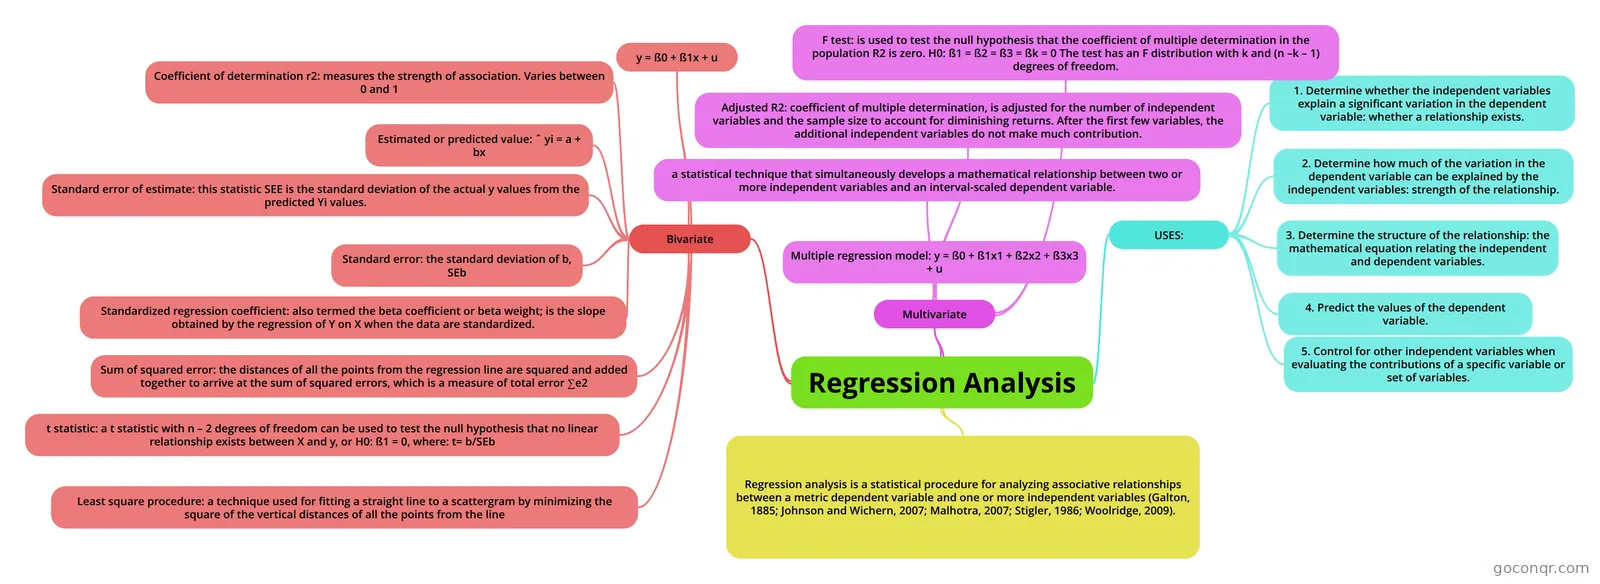
Mind map: regression analysis
Map content
Regression Analysis
Regression analysis is a statistical procedure for analyzing associative relationships between a metric dependent variable and one or more independent variables (Galton, 1885; Johnson and Wichern, 2007; Malhotra, 2007; Stigler, 1986; Woolridge, 2009).
USES:
- 1. Determine whether the independent variables explain a significant variation in the dependent variable: whether a relationship exists.
- 2. Determine how much of the variation in the dependent variable can be explained by the independent variables: strength of the relationship.
- 3. Determine the structure of the relationship: the mathematical equation relating the independent and dependent variables.
- 4. Predict the values of the dependent variable.
- 5. Control for other independent variables when evaluating the contributions of a specific variable or set of variables.
Multivariate
- a statistical technique that simultaneously develops a mathematical relationship between two or more independent variables and an interval-scaled dependent variable.
- Multiple regression model: y = ß0 + ß1x1 + ß2x2 + ß3x3 + u
- Adjusted R2: coefficient of multiple determination, is adjusted for the number of independent variables and the sample size to account for diminishing returns. After the first few variables, the additional independent variables do not make much contribution.
- F test: is used to test the null hypothesis that the coefficient of multiple determination in the population R2 is zero. H0: ß1 = ß2 = ß3 = ßk = 0 The test has an F distribution with k and (n –k – 1) degrees of freedom.
Bivariate
- y = ß0 + ß1x + u
- Coefficient of determination r2: measures the strength of association. Varies between 0 and 1
- Estimated or predicted value: ˆ yi = a + bx
- Standard error of estimate: this statistic SEE is the standard deviation of the actual y values from the predicted Yi values.
- Standard error: the standard deviation of b, SEb
- Standardized regression coefficient: also termed the beta coefficient or beta weight; is the slope obtained by the regression of Y on X when the data are standardized.
- Sum of squared error: the distances of all the points from the regression line are squared and added together to arrive at the sum of squared errors, which is a measure of total error ∑e2
- t statistic: a t statistic with n – 2 degrees of freedom can be used to test the null hypothesis that no linear relationship exists between X and y, or H0: ß1 = 0, where: t= b/SEb
- Least square procedure: a technique used for fitting a straight line to a scattergram by minimizing the square of the vertical distances of all the points from the line
Information
- Description
- Mind Map on Regression Analysis, created by Alicia de la Pena on 14/07/2013.
- Created by
- Alicia de la Pena
- Views
- 157
- Rating