
Mind map
Bivariate Statistical Measures Regression and Correlation
Map content
Bivariate Statistical Measures Regression and Correlation
¿What is it?
- Regression analysis is a statistical method for examining the relationship between two or more variables and identifying which variables have the greatest impact on a topic of interest.
- ¿What allows us to classify?
- This type of statistical analysis allows mathematical ranking through different questions such as: Which factors matter the most? Which factors can be ignored? How do these factors interact with each other, and finally, how confident do you feel about all these factors?
- The process of performing a regression allows us to determine with confidence which factors are most important, which can be ignored and how they influence each other. These factors are called variables, which are classified as follows:
- Dependent variable(s): the most important factor, which you are trying to understand or predict. Independent variable(s): The factor that you believe may impact your dependent variable.
- The process of performing a regression allows us to determine with confidence which factors are most important, which can be ignored and how they influence each other. These factors are called variables, which are classified as follows:
- This type of statistical analysis allows mathematical ranking through different questions such as: Which factors matter the most? Which factors can be ignored? How do these factors interact with each other, and finally, how confident do you feel about all these factors?
- ¿What allows us to classify?
- Regression analysis is a statistical method for examining the relationship between two or more variables and identifying which variables have the greatest impact on a topic of interest.
Description
- Regression analysis uses a chosen estimation method, a dependent variable, and one or more explanatory variables to create an equation that estimates values for the dependent variable. The regression model includes outputs, such as R2 and P-values, to provide information on the extent to which the model makes reliable estimates of the dependent variable.
- Uses
- Regression analysis can be used to solve the following types of problems: Determine which explanatory variables are related to the dependent variable - Understanding the relationship between the dependent and explanatory variables - Predicting unknown values of the dependent variable.
- Uses
- Regression analysis uses a chosen estimation method, a dependent variable, and one or more explanatory variables to create an equation that estimates values for the dependent variable. The regression model includes outputs, such as R2 and P-values, to provide information on the extent to which the model makes reliable estimates of the dependent variable.
TYPES
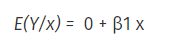
- SIMPLE LINEAR REGRESSION: the most widely used technique, it is a way of modeling a relationship between two sets of variables. The result is an equation that can be used to make projections or estimates on the data.
- MULTIPLE LINEAR REGRESSION: Multiple linear regression is a statistical technique that analyzes situations involving more than one variable. This method allows to identify which are the independent variables that can explain an independent variable, to test the causes and to predict in an approximate way the values of the independent variable.
- NON-LINEAR REGRESSION: Non-linear regression is a more complicated process where the number of parameters may not coincide with the number of explanatory variables. An example of a non-linear model in the parameters would be given by the following exponential function:
CORRELATION
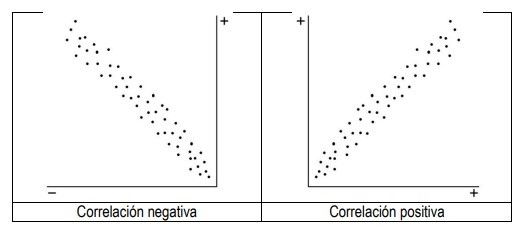
- It is the study of the non-causal association between two (or more) variables, i.e., whether changes in one variable correspond to changes in the other. changes in the other. These may be in the same direction (when one increases, the other increases: positive correlation) or in the opposite direction (when one increases, the other decreases: negative correlation).
- The strength of the correlation is measured by:
- - Product-moment correlation coefficient (Pearson's): for numerical variables.
- - Rank correlation coefficient (Spearman's): for ordinal variables.
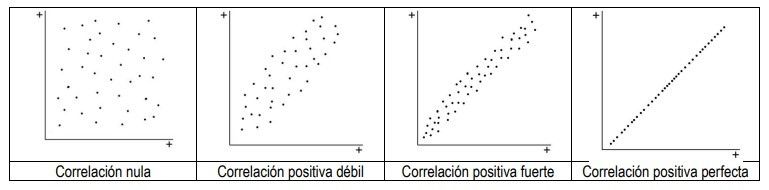
- -The correlation coefficient (r) ranges from perfect (-1 or 1) to null (0).
- The strength of the correlation is measured by:
- Correlation strength
- It is the closeness in the changes of both variables. The higher the correlation, the more they tend to form a straight line in the scatter plot. scatter diagram.
- PROCEDURE
- The general formula for calculating the correlation coefficient between two variables is:
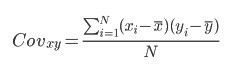
- The correlation coefficient is the result of dividing the covariance between variables X and Y by the square root of the product of the variance of X and that of Y.
- Formula for calculating the covariance between two variables
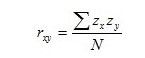
- The formula for Pearson's correlation coefficient is as follows:
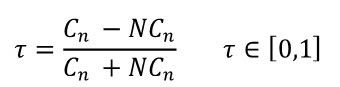
- The formula for Kendall's correlation coefficient is as follows:
- The general formula for calculating the correlation coefficient between two variables is:
- It is the study of the non-causal association between two (or more) variables, i.e., whether changes in one variable correspond to changes in the other. changes in the other. These may be in the same direction (when one increases, the other increases: positive correlation) or in the opposite direction (when one increases, the other decreases: negative correlation).
Images and files in the map



Information
- Description
- Mind Map on Bivariate Statistical Measures Regression and Correlation, created by Ileana Leal on 13/11/2022.
- Created by
- Ileana Leal · Nov 2022
- Updated
- Nov 14, 2022
- Views
- 2
- Rating