
Mind map
Bivariate statistical measures
Map content
Bivariate statistical measures
Correlation
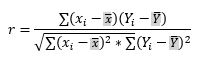
- Definition: A statistical measure that evaluates the strength and direction of the relationship between two variables.
- Types - methods: Pearson Spearman Kendall
- Pearson: Measures the linear relationship between two continuous variables.
- Spearman: Evaluates the monotonic (not necessarily linear) relationship between two variables.
- Kendall: Calculates the agreement between the orders of two data sets.
- Formula
- Interpretation:
- Value range: -1 to 1
- r close to 1: positive relationship
- r close to -1: negative relationship
- r close to 0: weak relationship
Linear regression
- Definition: A statistical model that describes the relationship between a dependent variable and one or more independent variables.
- Types or methods: simple, multiple
- Simple (an independent variable)
- Multiple (more than one independent variable)
- Coefficients:
- Intercept (a): Value of the dependent variable when all independent variables are zero.
- Coefficients (b): They represent the change in the dependent variable per unit change in the independent variable.
- formula
- Determination Coefficient(R^2)
- Indicates the proportion of the variability of the dependent variable that can be explained by the regression.
- Interpretation: R^2 close to 1 indicates good prediction ability.
Correlation Matrix
- Definition: A table that shows the correlations between all possible combinations of variables in a data set.
- Display:
- Represented as a square matrix.
- The element in row i and column j shows the correlation between the variables i and j.
- Utility:
- Identify patterns of association between variables.
- It helps to understand how variables relate to each other.
- It can be used for feature selection in multivariate analysis.
- Interpretation of values in the array:
- The values in the array vary between -1 and 1.
- -1: Perfect negative correlation.
- 1: Perfect positive correlation.
- 0: Absence of correlation.
- Values close to -1 or 1 indicate a strong correlation.
- Values close to 0 indicate a weak or no correlation.
Residue Analysis
- Definition: Evaluation of the differences between the observed values and the values predicted by the regression model.
- Importance:
- It allows verifying the validity of the regression model.
- Identify patterns not captured by the model.
- Helps detect possible violations of regression assumptions.
- Methods:
- Residue Charts:
- Visualization of residuals (differences between observed and predicted values) as a function of the independent variables.
- Non-random patterns in the graphs may indicate problems in the model.
- Residue Histogram:
- Graphic representation of the distribution of residuals.
- It helps evaluate whether the residuals follow a normal distribution.
- Residue Charts:
- Interpretation:
- Residuals close to 0 indicate that the model is predicting accurately.
- Patterns in the graphs may suggest the presence of nonlinearity or heteroscedasticity (non-constant variance).
- A histogram of residuals that resembles a normal distribution is desirable for statistical inference.
Atypical values
- Definition: Outliers or unusual values in a data set that differ significantly from the rest of the observations.
- identification:
- Visualizing data using boxplots, scatterplots, or statistical analysis such as the interquartile range rule.
- Observation of values that are outside specific ranges or that are statistically unusual
- Effects on Regression and Correlation:
- They can strongly influence the estimation of parameters in regressions.
- They have the potential to distort the strength and direction of the correlation.
- They can negatively affect the validity of statistical inferences.
- Outliers Treatment:
- Careful identification: Use graphical and statistical methods to confirm its presence.
- Impact assessment: Determine if the elimination of outliers is justified and understand its impact on results.
- Data transformation: Apply logarithmic or other transformations to reduce the influence of extreme values.
- Imputation of values: Replace outliers with more representative values.
- Robust models: Use robust methods that are less sensitive to the presence of outliers.
Images and files in the map

Information
- Description
- Mind Map on Bivariate statistical measures, created by Juliana Rodriguez on 20/11/2023.
- Created by
- Juliana Rodriguez
- Views
- 1
- Rating