
Mind map
QUALITY TOOLS
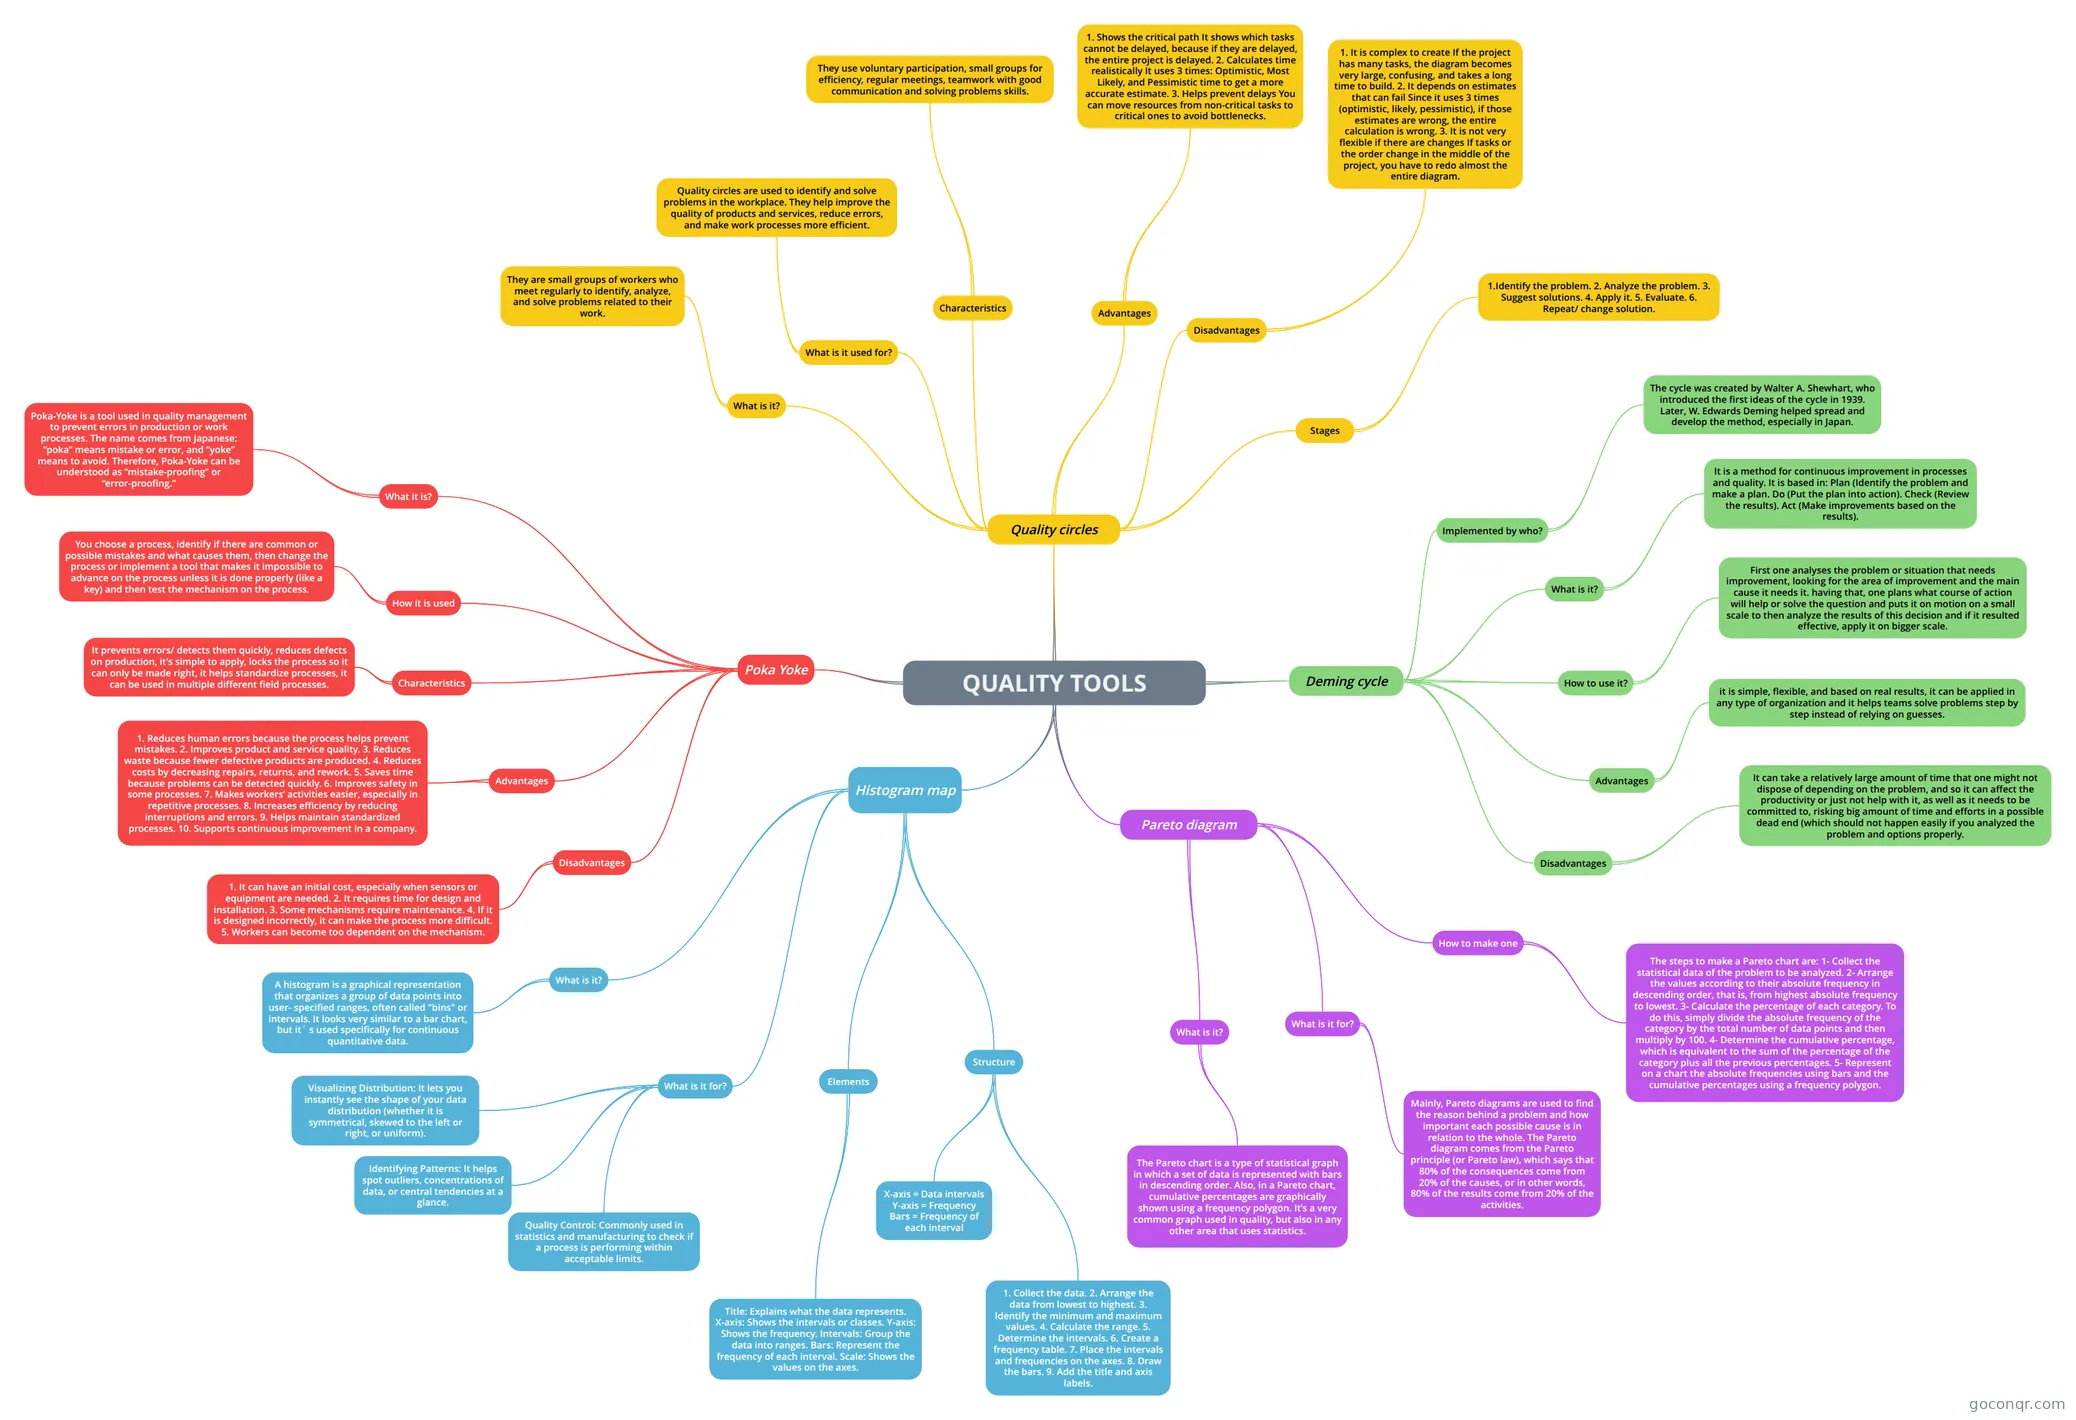
Mind map: Quality tools
Map content
QUALITY TOOLS
Histogram map
- What is it?
- A histogram is a graphical representation that organizes a group of data points into user- specified ranges, often called "bins" or intervals. It looks very similar to a bar chart, but it´ s used specifically for continuous quantitative data.
- What is it for?
- Visualizing Distribution: It lets you instantly see the shape of your data distribution (whether it is symmetrical, skewed to the left or right, or uniform).
- Identifying Patterns: It helps spot outliers, concentrations of data, or central tendencies at a glance.
- Quality Control: Commonly used in statistics and manufacturing to check if a process is performing within acceptable limits.
- Elements
- Title: Explains what the data represents. X-axis: Shows the intervals or classes. Y-axis: Shows the frequency. Intervals: Group the data into ranges. Bars: Represent the frequency of each interval. Scale: Shows the values on the axes.
- Structure
- X-axis = Data intervals Y-axis = Frequency Bars = Frequency of each interval
- 1. Collect the data. 2. Arrange the data from lowest to highest. 3. Identify the minimum and maximum values. 4. Calculate the range. 5. Determine the intervals. 6. Create a frequency table. 7. Place the intervals and frequencies on the axes. 8. Draw the bars. 9. Add the title and axis labels.
- What is it?
Quality circles
- What is it?
- They are small groups of workers who meet regularly to identify, analyze, and solve problems related to their work.
- What is it used for?
- Quality circles are used to identify and solve problems in the workplace. They help improve the quality of products and services, reduce errors, and make work processes more efficient.
- Characteristics
- They use voluntary participation, small groups for efficiency, regular meetings, teamwork with good communication and solving problems skills.
- Advantages
- 1. Shows the critical path It shows which tasks cannot be delayed, because if they are delayed, the entire project is delayed. 2. Calculates time realistically It uses 3 times: Optimistic, Most Likely, and Pessimistic time to get a more accurate estimate. 3. Helps prevent delays You can move resources from non-critical tasks to critical ones to avoid bottlenecks.
- Disadvantages
- 1. It is complex to create If the project has many tasks, the diagram becomes very large, confusing, and takes a long time to build. 2. It depends on estimates that can fail Since it uses 3 times (optimistic, likely, pessimistic), if those estimates are wrong, the entire calculation is wrong. 3. It is not very flexible if there are changes If tasks or the order change in the middle of the project, you have to redo almost the entire diagram.
- Stages
- 1.Identify the problem. 2. Analyze the problem. 3. Suggest solutions. 4. Apply it. 5. Evaluate. 6. Repeat/ change solution.
- What is it?
Deming cycle
- Implemented by who?
- The cycle was created by Walter A. Shewhart, who introduced the first ideas of the cycle in 1939. Later, W. Edwards Deming helped spread and develop the method, especially in Japan.
- What is it?
- It is a method for continuous improvement in processes and quality. It is based in: Plan (Identify the problem and make a plan. Do (Put the plan into action). Check (Review the results). Act (Make improvements based on the results).
- How to use it?
- First one analyses the problem or situation that needs improvement, looking for the area of improvement and the main cause it needs it. having that, one plans what course of action will help or solve the question and puts it on motion on a small scale to then analyze the results of this decision and if it resulted effective, apply it on bigger scale.
- Advantages
- it is simple, flexible, and based on real results, it can be applied in any type of organization and it helps teams solve problems step by step instead of relying on guesses.
- Disadvantages
- It can take a relatively large amount of time that one might not dispose of depending on the problem, and so it can affect the productivity or just not help with it, as well as it needs to be committed to, risking big amount of time and efforts in a possible dead end (which should not happen easily if you analyzed the problem and options properly.
- Implemented by who?
Poka Yoke
- What it is?
- Poka-Yoke is a tool used in quality management to prevent errors in production or work processes. The name comes from Japanese: “poka” means mistake or error, and “yoke” means to avoid. Therefore, Poka-Yoke can be understood as “mistake-proofing” or “error-proofing.”
- How it is used
- You choose a process, identify if there are common or possible mistakes and what causes them, then change the process or implement a tool that makes it impossible to advance on the process unless it is done properly (like a key) and then test the mechanism on the process.
- Characteristics
- It prevents errors/ detects them quickly, reduces defects on production, it's simple to apply, locks the process so it can only be made right, it helps standardize processes, it can be used in multiple different field processes.
- Advantages
- 1. Reduces human errors because the process helps prevent mistakes. 2. Improves product and service quality. 3. Reduces waste because fewer defective products are produced. 4. Reduces costs by decreasing repairs, returns, and rework. 5. Saves time because problems can be detected quickly. 6. Improves safety in some processes. 7. Makes workers’ activities easier, especially in repetitive processes. 8. Increases efficiency by reducing interruptions and errors. 9. Helps maintain standardized processes. 10. Supports continuous improvement in a company.
- Disadvantages
- 1. It can have an initial cost, especially when sensors or equipment are needed. 2. It requires time for design and installation. 3. Some mechanisms require maintenance. 4. If it is designed incorrectly, it can make the process more difficult. 5. Workers can become too dependent on the mechanism.
- What it is?
Pareto diagram
- What is it?
- The Pareto chart is a type of statistical graph in which a set of data is represented with bars in descending order. Also, in a Pareto chart, cumulative percentages are graphically shown using a frequency polygon. It’s a very common graph used in quality, but also in any other area that uses statistics.
- What is it for?
- Mainly, Pareto diagrams are used to find the reason behind a problem and how important each possible cause is in relation to the whole. The Pareto diagram comes from the Pareto principle (or Pareto law), which says that 80% of the consequences come from 20% of the causes, or in other words, 80% of the results come from 20% of the activities.
- How to make one
- The steps to make a Pareto chart are: 1- Collect the statistical data of the problem to be analyzed. 2- Arrange the values according to their absolute frequency in descending order, that is, from highest absolute frequency to lowest. 3- Calculate the percentage of each category. To do this, simply divide the absolute frequency of the category by the total number of data points and then multiply by 100. 4- Determine the cumulative percentage, which is equivalent to the sum of the percentage of the category plus all the previous percentages. 5- Represent on a chart the absolute frequencies using bars and the cumulative percentages using a frequency polygon.
- What is it?
Information
- Description
- Mind Map on QUALITY TOOLS, created by LUCIA ELEONOR ESPARZA SAUCEDO on 12/06/2026.
- Created by
- LUCIA ELEONOR ESPARZA SAUCEDO
- Views
- 3
- Rating
More on Quality Tools and Techniques