
Mind map
Quality tools
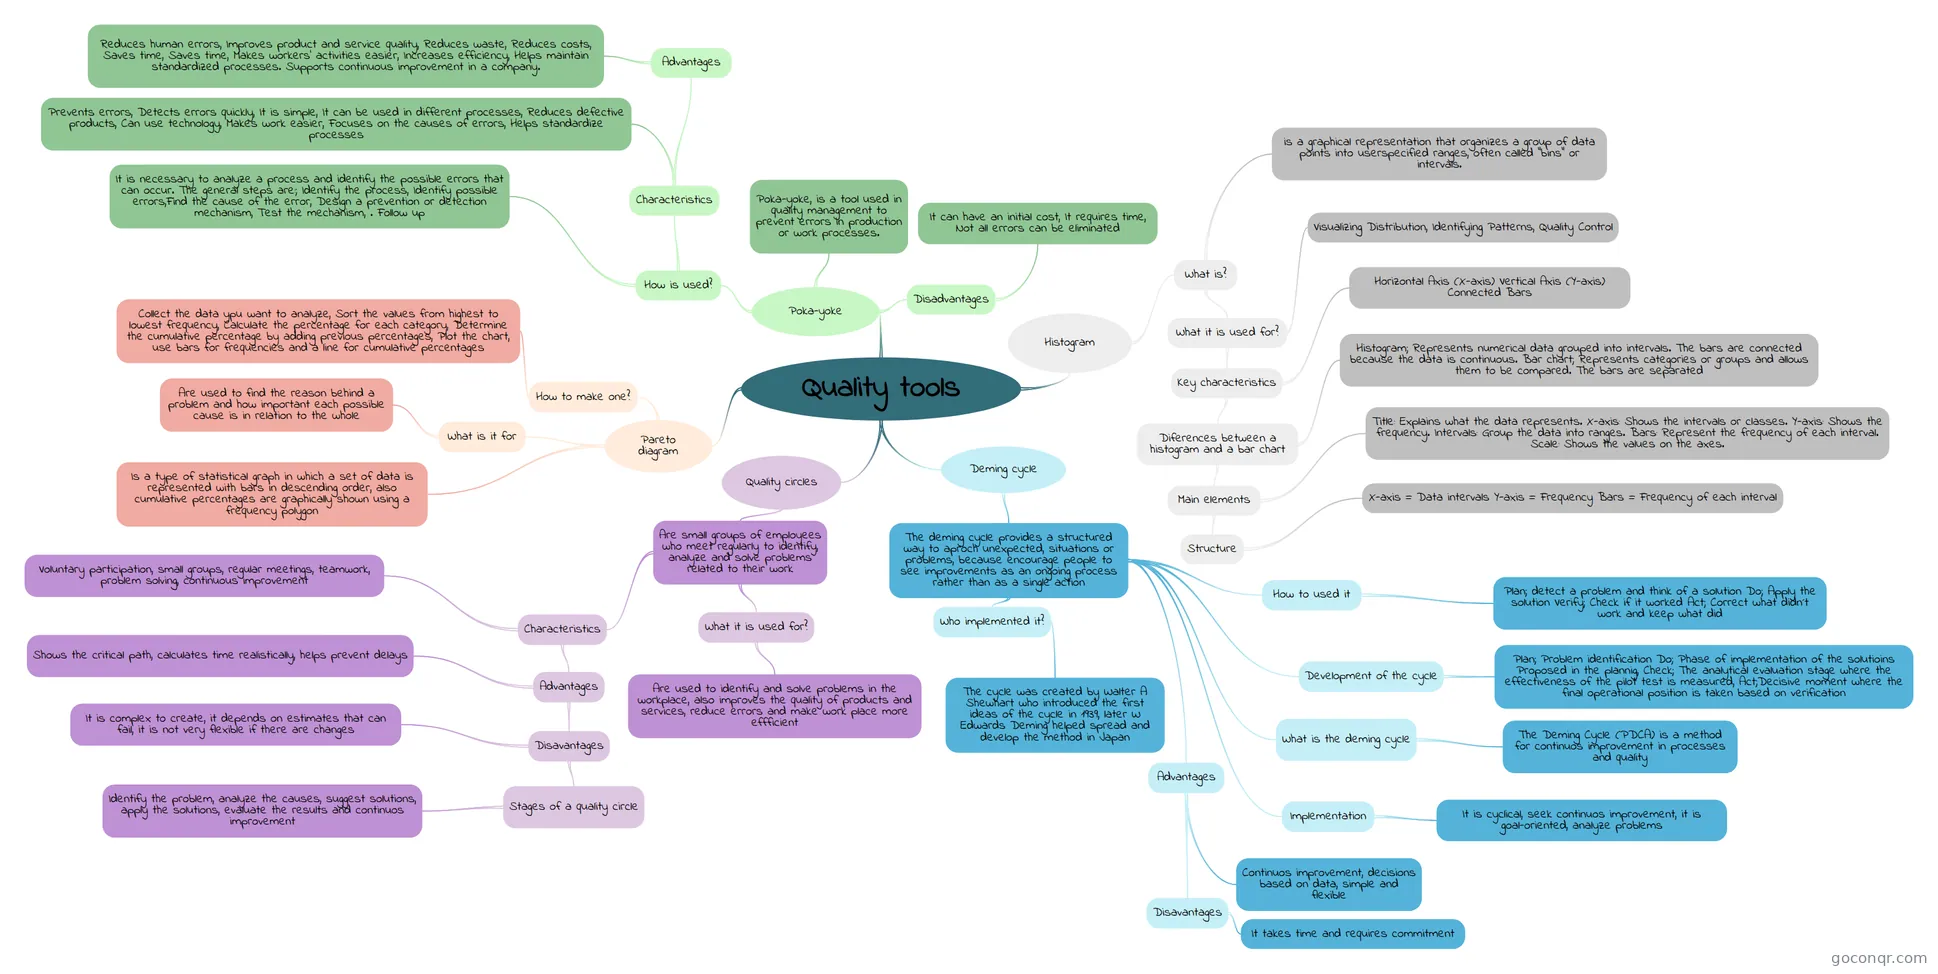
Mind map: Quality tools
Map content
Quality tools
Pareto diagram
- Is a type of statistical graph in which a set of data is represented with bars in descending order, also cumulative percentages are graphically shown using a frequency polygon
- What is it for
- Are used to find the reason behind a problem and how important each possible cause is in relation to the whole
- How to make one?
- Collect the data ypu want to analyze, Sort the values from highest to lowest frequency, Calculate the percentage for each category, Determine the cumulative percentage by adding previous percentages, Plot the chart, use bars for frequencies and a line for cumulative percentages
Histogram
- What is?
- is a graphical representation that organizes a group of data points into userspecified ranges, often called "bins" or intervals.
- What it is used for?
- Visualizing Distribution, Identifying Patterns, Quality Control
- Key characteristics
- Horizontal Axis (X-axis) Vertical Axis (Y-axis) Connected Bars
- Diferences between a histogram and a bar chart
- Histogram; Represents numerical data grouped into intervals. The bars are connected because the data is continuous. Bar chart; Represents categories or groups and allows them to be compared. The bars are separated
- Main elements
- Title: Explains what the data represents. X-axis: Shows the intervals or classes. Y-axis: Shows the frequency. Intervals: Group the data into ranges. Bars: Represent the frequency of each interval. Scale: Shows the values on the axes.
- Structure
- X-axis = Data intervals Y-axis = Frequency Bars = Frequency of each interval
- What is?
Poka-yoke
- Poka-yoke, is a tool used in quality management to prevent errors in production or work processes.
- How is used?
- It is necessary to analyze a process and identify the possible errors that can occur. The general steps are:; Identify the process, Identify possible errors,Find the cause of the error, Design a prevention or detection mechanism, Test the mechanism, . Follow up
- Characteristics
- Prevents errors, Detects errors quickly, It is simple, It can be used in different processes, Reduces defective products, Can use technology, Makes work easier, Focuses on the causes of errors, Helps standardize processes
- Advantages
- Reduces human errors, Improves product and service quality, Reduces waste, Reduces costs, Saves time, Saves time, Makes workers’ activities easier, Increases efficiency, Helps maintain standardized processes. Supports continuous improvement in a company.
- Disadvantages
- It can have an initial cost, It requires time, Not all errors can be eliminated
Quality circles
- Are small groups of employees who meet regularly to identify, analyze and solve problems related to their work
- What it is used for?
- Are used to identify and solve problems in the workplace, also improves the quality of products and services, reduce errors and make work place more effficient
- Characteristics
- Voluntary participation, small groups, regular meetings, teamwork, problem solving, continuous improvement
- Advantages
- Shows the critical path, calculates time realistically, helps prevent delays
- Disavantages
- It is complex to create, it depends on estimates that can fail, it is not very flexible if there are changes
- Stages of a quality circle
- Identify the problem, analyze the causes, suggest solutions, apply the solutions, evaluate the results and continuos improvement
- What it is used for?
- Are small groups of employees who meet regularly to identify, analyze and solve problems related to their work
Deming cycle
- The deming cycle provides a structured way to aproch unexpected, situations or problems, because encourage people to see improvements as an ongoing process rather than as a single action
- Who implemented it?
- The cycle was created by Walter A Shewhart who introduced the first ideas of the cycle in 1939, later W Edwards Deming helped spread and develop the method in Japan
- What is the deming cycle
- The Deming Cycle (PDCA) is a method for continuos improvement in processes and quality
- Development of the cycle
- Plan; Problem identification Do; Phase of implementation of the solutioins Proposed in the plannig, Check; The analytical evaluation stage where the effectiveness of the pilot test is measured, Act;Decisive moment where the final operational position is taken based on verification
- How to used it
- Plan; detect a problem and think of a solution Do; Apply the solution Verify; Check if it worked Act; Correct what didn´t work and keep what did
- Implementation
- It is cyclical, seek continuos improvement, it is goal-oriented, analyze problems
- Advantages
- Continuos improvement, decisions based on data, simple and flexible
- Disavantages
- It takes time and requires commitment
- Who implemented it?
- The deming cycle provides a structured way to aproch unexpected, situations or problems, because encourage people to see improvements as an ongoing process rather than as a single action
Information
- Description
- Mind Map on Quality tools, created by MARELY PEREZ GONZALEZ on 16/10/2026.
- Created by
- MARELY PEREZ GONZALEZ
- Views
- 6
- Rating
More on Quality Tools and Techniques