
Mind map
Research Skills 4
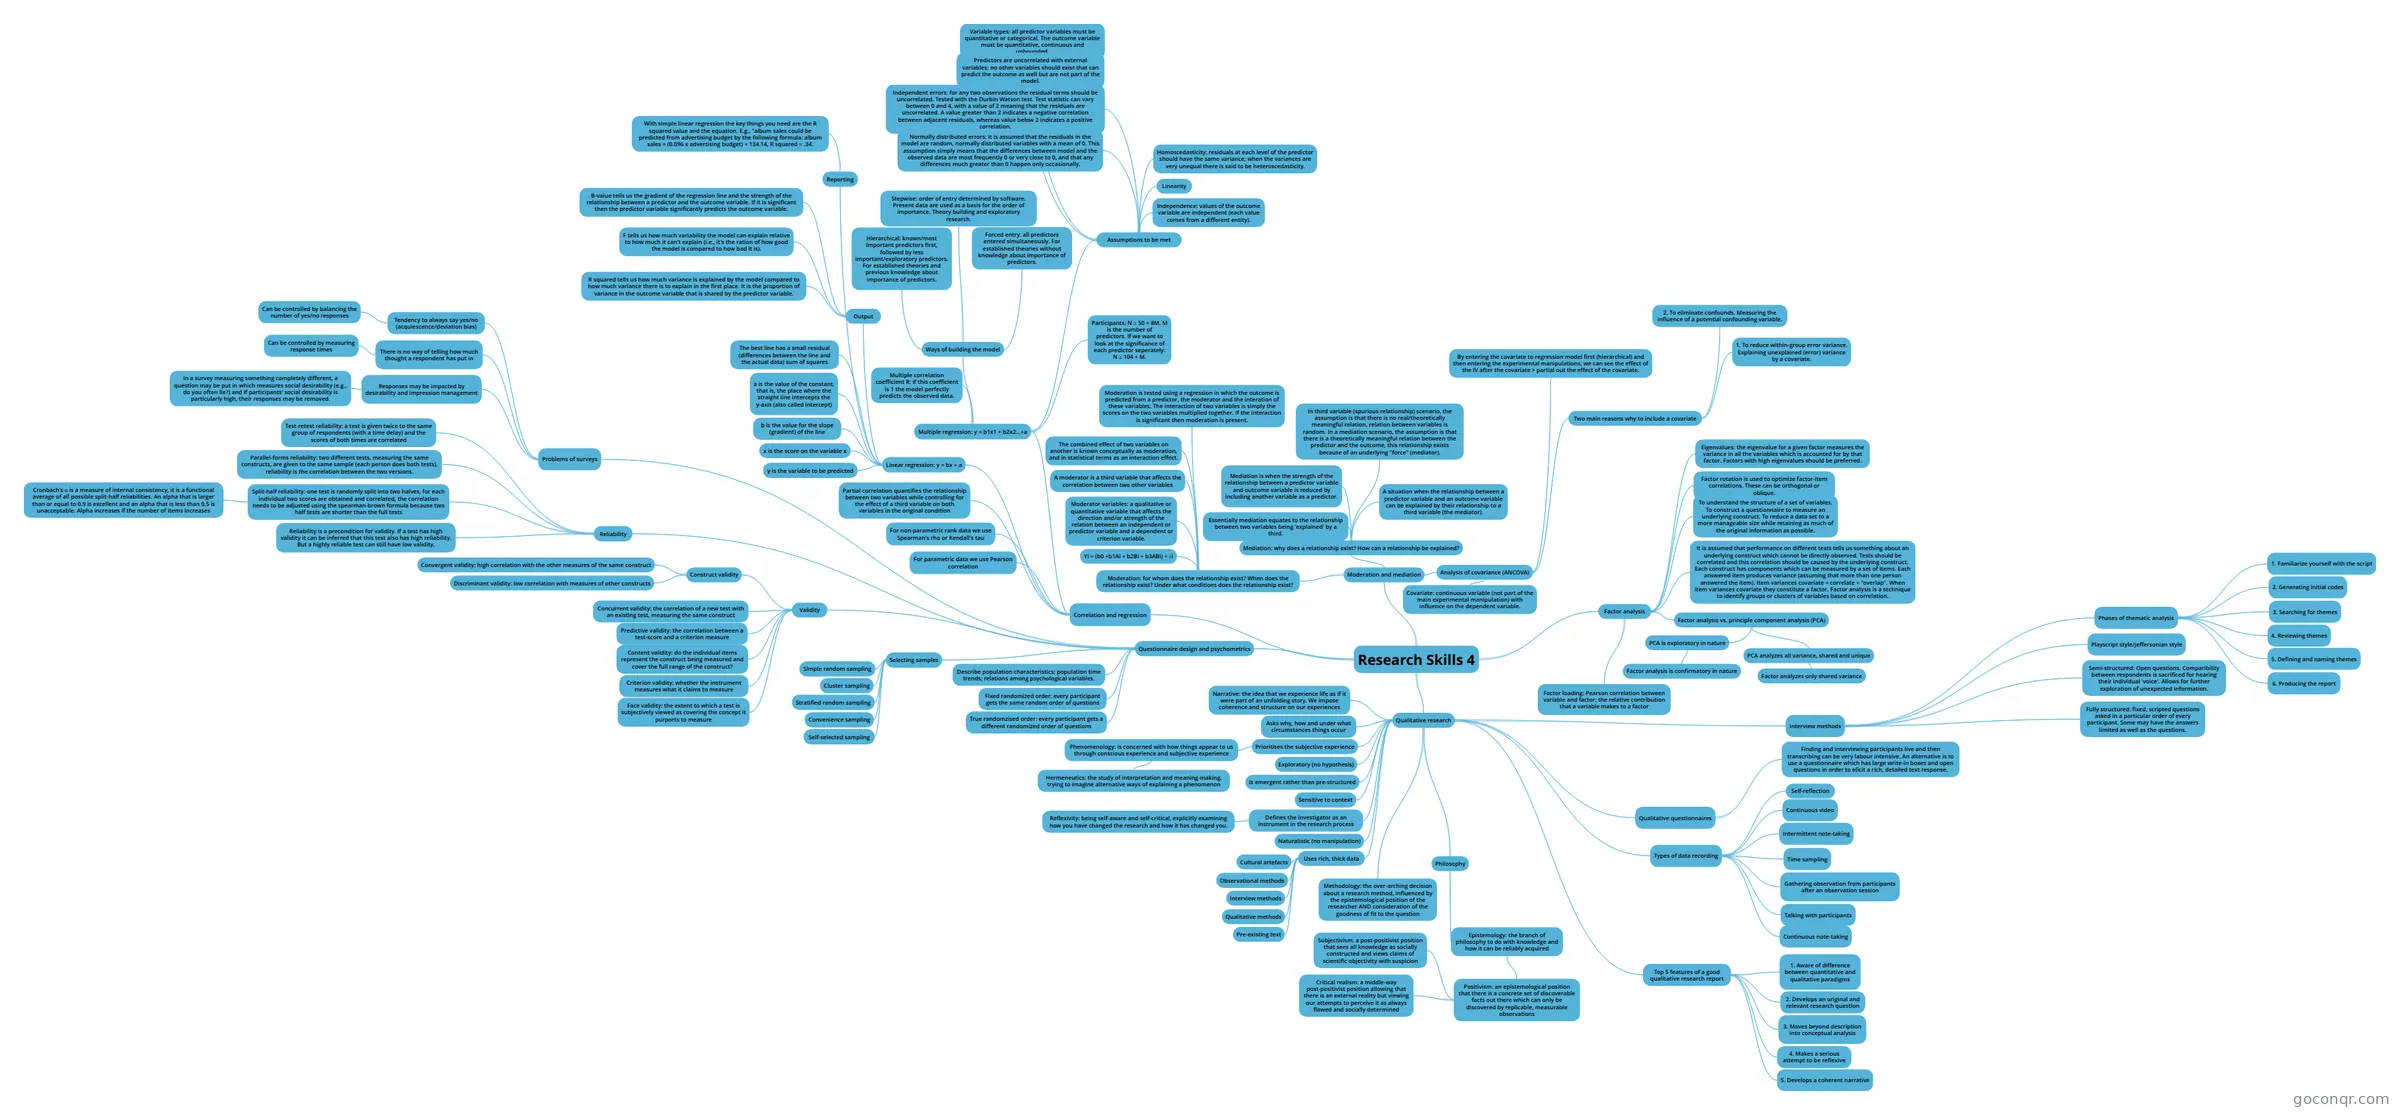
Mind map: Research skills
Map content
Research Skills 4
Qualitative research
- Exploratory (no hypothesis)
- Naturalistic (no manipulation)
- Sensitive to context
- Prioritises the subjective experience
- Phenomenology: is concerned with how things appear to us through conscious experience and subjective experience
- Hermeneutics: the study of interpretation and meaning-making, trying to imagine alternative ways of explaining a phenomenon
- Phenomenology: is concerned with how things appear to us through conscious experience and subjective experience
- Asks why, how and under what circumstances things occur
- Is emergent rather than pre-structured
- Defines the investigator as an instrument in the research process
- Reflexivity: being self-aware and self-critical, explicitly examining how you have changed the research and how it has changed you.
- Uses rich, thick data
- Cultural artefacts
- Pre-existing text
- Observational methods
- Qualitative methods
- Interview methods
- Philosophy
- Epistemology: the branch of philosophy to do with knowledge and how it can be reliably acquired
- Positivism: an epistemological position that there is a concrete set of discoverable facts out there which can only be discovered by replicable, measurable observations
- Subjectivism: a post-positivist position that sees all knowledge as socially constructed and views claims of scientific objectivity with suspicion
- Critical realism: a middle-way post-positivist position allowing that there is an external reality but viewing our attempts to perceive it as always flawed and socially determined
- Positivism: an epistemological position that there is a concrete set of discoverable facts out there which can only be discovered by replicable, measurable observations
- Epistemology: the branch of philosophy to do with knowledge and how it can be reliably acquired
- Methodology: the over-arching decision about a research method, influenced by the epistemological position of the researcher AND consideration of the goodness of fit to the question
- Narrative: the idea that we experience life as if it were part of an unfolding story. We impose coherence and structure on our experiences
- Types of data recording
- Continuous video
- Continuous note-taking
- Intermittent note-taking
- Time sampling
- Self-reflection
- Talking with participants
- Gathering observation from participants after an observation session
- Qualitative questionnaires
- Finding and interviewing participants live and then transcribing can be very labour intensive. An alternative is to use a questionnaire which has large write-in boxes and open questions in order to elicit a rich, detailed text response.
- Interview methods
- Fully structured: fixed, scripted questions asked in a particular order of every participant. Some may have the answers limited as well as the questions.
- Semi-structured: Open questions. Comparibility between respondents is sacrificed for hearing their individual 'voice'. Allows for further exploration of unexpected information.
- Playscript style/jeffersonian style
- Phases of thematic analysis
- 1. Familiarize yourself with the script
- 2. Generating initial codes
- 3. Searching for themes
- 4. Reviewing themes
- 5. Defining and naming themes
- 6. Producing the report
- Top 5 features of a good qualitative research report
- 1. Aware of difference between quantitative and qualitative paradigms
- 2. Develops an original and relevant research question
- 3. Moves beyond description into conceptual analysis
- 4. Makes a serious attempt to be reflexive
- 5. Develops a coherent narrative
Questionnaire design and psychometrics
- Describe population characteristics; population time trends; relations among psychological variables.
- Selecting samples
- Simple random sampling
- Stratified random sampling
- Cluster sampling
- Convenience sampling
- Self-selected sampling
- Fixed randomized order: every participant gets the same random order of questions
- True randomzised order: every participant gets a different randomized order of questions
- Problems of surveys
- Responses may be impacted by desirability and impression management
- In a survey measuring something completely different, a question may be put in which measures social desirability (e.g., do you often lie?) and if participants' social desirability is particularly high, their responses may be removed.
- Tendency to always say yes/no (acquiescence/deviation bias)
- Can be controlled by balancing the number of yes/no responses
- There is no way of telling how much thought a respondent has put in
- Can be controlled by measuring response times
- Responses may be impacted by desirability and impression management
- Reliability
- Test-retest reliability: a test is given twice to the same group of respondents (with a time delay) and the scores of both times are correlated
- Parallel-forms reliability: two different tests, measuring the same constructs, are given to the same sample (each person does both tests), reliability is the correlation between the two versions.
- Split-half reliability: one test is randomly split into two halves, for each individual two scores are obtained and correlated, the correlation needs to be adjusted using the spearman-brown formula because two half tests are shorter than the full tests
- Cronbach's α is a measure of internal consistency, it is a functional average of all possible split-half reliabilities. An alpha that is larger than or equal to 0.9 is excellent and an alpha that is less than 0.5 is unacceptable. Alpha increases if the number of items increases
- Reliability is a precondition for validity. If a test has high validity it can be inferred that this test also has high reliability. But a highly reliable test can still have low validity.
- Validity
- Face validity: the extent to which a test is subjectively viewed as covering the concept it purports to measure
- Criterion validity: whether the instrument measures what it claims to measure
- Content validity: do the individual items represent the construct being measured and cover the full range of the construct?
- Predictive validity: the correlation between a test-score and a criterion measure
- Concurrent validity: the correlation of a new test with an existing test, measuring the same construct
- Construct validity
- Convergent validity: high correlation with the other measures of the same construct
- Discriminant validity: low correlation with measures of other constructs
Correlation and regression
- For parametric data we use Pearson correlation
- For non-parametric rank data we use Spearman's rho or Kendall's tau
- Partial correlation quantifies the relationship between two variables while controlling for the effect of a third variable on both variables in the original condition
- Linear regression: y = bx + a
- y is the variable to be predicted
- x is the score on the variable x
- b is the value for the slope (gradient) of the line
- a is the value of the constant, that is, the place where the straight line intercepts the y-axis (also called intercept)
- The best line has a small residual (differences between the line and the actual data) sum of squares
- Output
- R squared tells us how much variance is explained by the model compared to how much variance there is to explain in the first place. It is the proportion of variance in the outcome variable that is shared by the predictor variable.
- F tells us how much variability the model can explain relative to how much it can't explain (i.e., it's the ration of how good the model is compared to how bad it is).
- B-value tells us the gradient of the regression line and the strength of the relationship between a predictor and the outcome variable. If it is significant then the predictor variable significantly predicts the outcome variable.
- Reporting
- With simple linear regression the key things you need are the R squared value and the equation. E.g., "album sales could be predicted from advertising budget by the following formula: album sales = (0.096 x advertising budget) + 134.14, R squared = .34.
- Multiple regression: y = b1x1 + b2x2...+a
- Multiple correlation coefficient R: if this coefficient is 1 the model perfectly predicts the observed data.
- Ways of building the model
- Hierarchical: known/most important predictors first, followed by less important/exploratory predictors. For established theories and previous knowledge about importance of predictors.
- Forced entry: all predictors entered simultaneously. For established theories without knowledge about importance of predictors.
- Stepwise: order of entry determined by software. Present data are used as a basis for the order of importance. Theory building and exploratory research.
- Assumptions to be met
- Linearity
- Variable types: all predictor variables must be quantitative or categorical. The outcome variable must be quantitative, continuous and unbounded.
- Independence: values of the outcome variable are independent (each value comes from a different entity).
- Normally distributed errors: it is assumed that the residuals in the model are random, normally distributed variables with a mean of 0. This assumption simply means that the differences between model and the observed data are most frequently 0 or very close to 0, and that any differences much greater than 0 happen only occasionally.
- Independent errors: for any two observations the residual terms should be uncorrelated. Tested with the Durbin Watson test. Test statistic can vary between 0 and 4, with a value of 2 meaning that the residuals are uncorrelated. A value greater than 2 indicates a negative correlation between adjacent residuals, whereas value below 2 indicates a positive correlation.
- Homoscedasticity: residuals at each level of the predictor should have the same variance; when the variances are very unequal there is said to be heteroscedasticity.
- Predictors are uncorrelated with external variables: no other variables should exist that can predict the outcome as well but are not part of the model.
- Participants: N ≥ 50 + 8M. M is the number of predictors. If we want to look at the significance of each predictor seperately: N ≥ 104 + M.
Moderation and mediation
- Mediation: why does a relationship exist? How can a relationship be explained?
- Mediation is when the strength of the relationship between a predictor variable and outcome variable is reduced by including another variable as a predictor.
- Essentially mediation equates to the relationship between two variables being 'explained' by a third.
- In third variable (spurious relationship) scenario, the assumption is that there is no real/theoretically meaningful relation, relation between variables is random. In a mediation scenario, the assumption is that there is a theoretically meaningful relation between the predictor and the outcome, this relationship exists because of an underlying "force" (mediator).
- A situation when the relationship between a predictor variable and an outcome variable can be explained by their relationship to a third variable (the mediator).
- Moderation: for whom does the relationship exist? When does the relationship exist? Under what conditions does the relationship exist?
- Moderator variables: a qualitative or quantitative variable that affects the direction and/or strength of the relation between an independent or predictor variable and a dependent or criterion variable.
- A moderator is a third variable that affects the correlation between two other variables
- The combined effect of two variables on another is known conceptually as moderation, and in statistical terms as an interaction effect.
- Yi = (b0 +b1Ai + b2Bi + b3ABi) + εi
- Moderation is tested using a regression in which the outcome is predicted from a predictor, the moderator and the interation of these variables. The interaction of two variables is simply the scores on the two variables multiplied together. If the interaction is significant then moderation is present.
- Analysis of covariance (ANCOVA)
- Covariate: continuous variable (not part of the main experimental manipulation) with influence on the dependent variable.
- Two main reasons why to include a covariate
- 1. To reduce within-group error variance. Explaining unexplained (error) variance by a covariate.
- 2. To eliminate confounds. Measuring the influence of a potential confounding variable.
- By entering the covariate to regression model first (hierarchical) and then entering the experimental manipulations, we can see the effect of the IV after the covariate > partial out the effect of the covariate.
- Mediation: why does a relationship exist? How can a relationship be explained?
Factor analysis
- It is assumed that performance on different tests tells us something about an underlying construct which cannot be directly observed. Tests should be correlated and this correlation should be caused by the underlying construct. Each construct has components which can be measured by a set of items. Each answered item produces variance (assuming that more than one person answered the item). Item variances covariate = correlate = "overlap". When item variances covariate they constitute a factor. Factor analysis is a technique to identify groups or clusters of variables based on correlation.
- To understand the structure of a set of variables. To construct a questionnaire to measure an underlying construct. To reduce a data set to a more manageable size while retaining as much of the original information as possible.
- Factor analysis vs. principle component analysis (PCA)
- PCA is exploratory in nature
- Factor analysis is confirmatory in nature
- PCA analyzes all variance, shared and unique
- Factor analyzes only shared variance
- PCA is exploratory in nature
- Factor loading: Pearson correlation between variable and factor: the relative contribution that a variable makes to a factor
- Factor rotation is used to optimize factor-item correlations. These can be orthogonal or oblique.
- Eigenvalues: the eigenvalue for a given factor measures the variance in all the variables which is accounted for by that factor. Factors with high eigenvalues should be preferred.
Information
- Description
- Mind Map on Research Skills 4, created by Jasmine Poxon on 16/04/2018.
- Created by
- Jasmine Poxon
- Views
- 1
- Rating