
Mind map
How to Graph a Function
Map content
How to Graph a Function
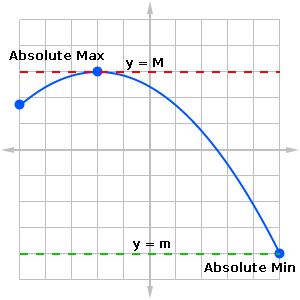
4) Identify absolute extremas (max/min)
- First, use the critical points found to aply the first derivative test.
- Finally, Graph, and locate absolute extremas by plugging x-values to get the y-values.
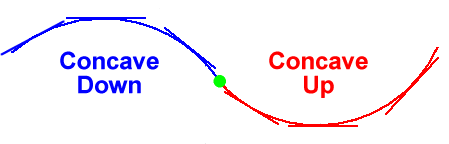
5) Identify inflection points
- First, if the graph is below the tangent line it is concave down.
- Second, If the graph is above tangent line is concave up.
- Finally, a change in concavity is equal to an inflection point
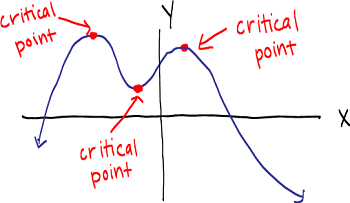
1) Find Critical Points
- Second, equal the function to zero and solve.
- First, derive the function.
- Finally, the points found are the critical points.
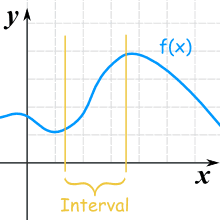
2) Determine which intervals are increasing and decreasing
- First, use the critical points to subdivide the domain.
- Finally, look for the final sign (+ or -) to determine if its increasing or decreasing
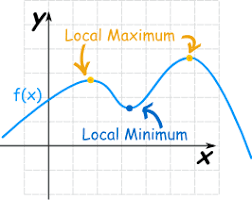
3) Determine local maximum and minimum
- First, you need to have your increasing/decreasing intervals, and the x value is the local max/min.
- Second, if the x value goes from - to + x will be the local minimum.
- Finally, if the x value goes from - to + x will be the local minimum.
Images and files in the map
Information
- Description
- Mind Map on How to Graph a Function, created by Sebastian Alvarez on 11/19/2018.
- Created by
- Sebastian Alvarez
- Views
- 0
- Rating