
Mind map
Continuous Random Variable
Map content
Continuous Random Variable
The variable that has infinite number of values.
- In other words, any value is possible for the variable
These values are often associated with measurements on a continuous scale with no gaps or interruption, such as time based events
The probability for any single value is equal to zero
We are now interested in the probability of the value located within a region
Density curve
- A graph, which must satisfy two properties
- The total area under the curve must equal one
- Every point on the curve must have a vertical height that is zero or greater
- The curve cannot fall below the x-axis
- Because the total area under the density curve equals one, there is correspondence between area and probability
- To find the probability that variables are located within a region, our aim will become finding the area of this region.
- A graph, which must satisfy two properties
We are no longer interested in the probability of a single variable
Uniform distribution
- Values spread evenly over the range of possibilities
- A uniform continuous distribution must have two parameters
- minimum possible value (a)
- maximum possible value ( b)
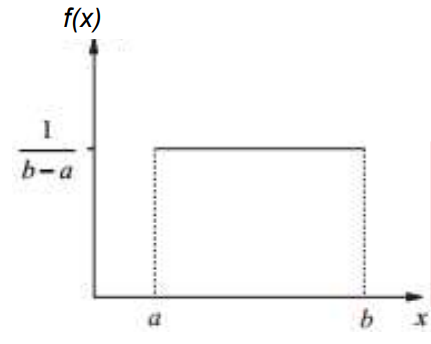
- The density curve is a straight line
- The probability area will be a rectangular-shaped graph
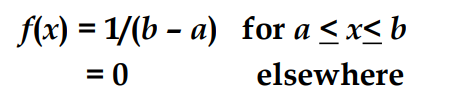
- Uniform probabilty density
- Note: This is an entire function to describe a uniform continous distribution
- f(x) is not the probability for a singular variable
- where: a = smallest value the variable can assume b = largest value the variable can assume
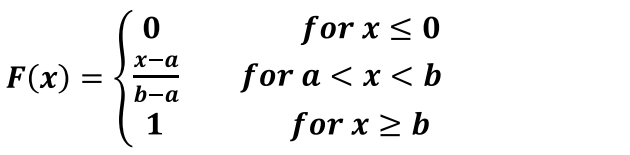
- Cumulative distribution function (CDF)
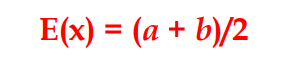
- Expected Value of x
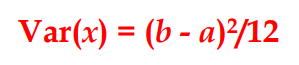
- Variance of x
Normal Distribution
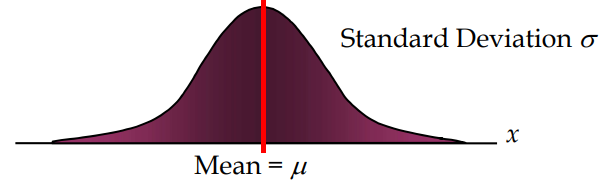
- a continuous random variable that has a distribution with a graph that is symmetric and bell-shaped, we call it that it is a normal distribution
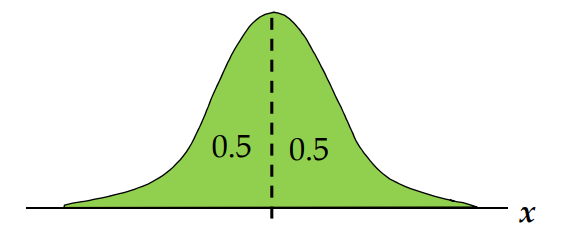
- The highest point on the normal curve is at the mean, which is also the median and mode.
- Standard deviation
- Determines the width of the curve.
- Probabilities for the normal random variable are given by areas under the curve. The total area under the curve is 1
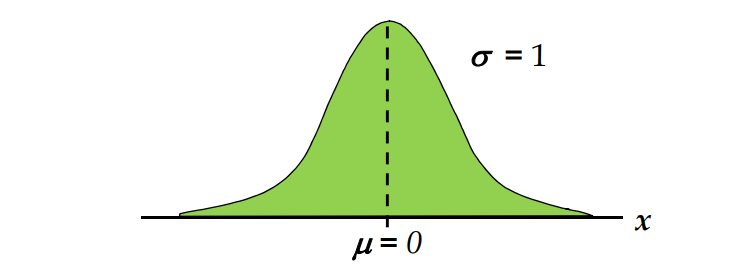
- Standard Normal distribution
- Mean equal to zero
- Standard deviation equal to one
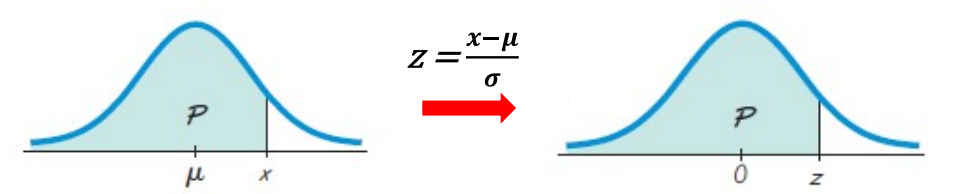
- A non-standard normal distribution can be converted to a standard normal distribution of its z score values
- The letter z is used to designate the standard normal random variable.
- Standard normal distribution tables
- Based on the standard normal distribution density function, statistics pioneers and mathematicians had calculated many different areas under the density curve and created a standard normal distribution table
- One can quickly find the probability with a given z score
- Using the z table, we measure the z score from the right side of the curve
- Probabilities corresponding to different areas are grouped against scores
- Z score is the distance along the horizontal scale of the standard distribution
- When using the table, avoid confusing z scores and areas:
- If we want P ( Z < -z ), we can use the properties that the area under the curve = 1
- Hence, if we want P(Z < -1.2), then this is equal to P(Z > +1.2) = 0.1151 (from table)
- By using standard normal distribution table, we can find the probability related to a z score
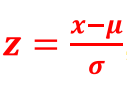
- Finding the probability related to the real variable x (i.e Non-Standard normal distribution)
- This is done by using the formula
- Based on the standard normal distribution density function, statistics pioneers and mathematicians had calculated many different areas under the density curve and created a standard normal distribution table
- Non-standard Normal Distribution
- Mean of variables: μ ≠ 0
- Variance of variables: σ2 ≠ 1
- Mean of for all variables: μz = 0
- Variance of for all variables: σz2 =1
- Normal Distributions Approximation to Binomial Distribution
- methods for using a normal distribution as an approximation to a binominal probability distribution
- If np ≥ 5 and nq ≥ 5, or then probabilities from a binominal probability distribution can be approximated reasonably well
- We must use a ‘continuity correction’ to alter the fact that binominal is discrete for random variable x
- Thus, a whole number x is represented by the interval: x - 0.5 to x + 0.5
- 1. Check that above requirements are satisfied
- 2. Find values for μ and σ (use formulas given)
- 3. Identify the discrete value x, and replace with interval given above (±0.5)
- 4. Draw a normal curve and enter the values calculated above in steps 2 and 3 (as appropriate, change x with the interval given)
- 5. Find the desired area under the curve by locating the first z score (use formula)
- 6. Use this z score to find area to the left of the adjusted value x
- 5. Find the desired area under the curve by locating the first z score (use formula)
- 4. Draw a normal curve and enter the values calculated above in steps 2 and 3 (as appropriate, change x with the interval given)
- 3. Identify the discrete value x, and replace with interval given above (±0.5)
- 2. Find values for μ and σ (use formulas given)
- methods for using a normal distribution as an approximation to a binominal probability distribution
- a continuous random variable that has a distribution with a graph that is symmetric and bell-shaped, we call it that it is a normal distribution
Images and files in the map



Information
- Description
- Mind Map on Continuous Random Variable, created by Henry Yannaghas on 07/01/2020.
- Created by
- Henry Yannaghas
- Views
- 2
- Rating