210826
Description
Mind Map by shirley.ha, updated more than 1 year ago
|
|
Created by shirley.ha
over 12 years ago
|
|
P-values
- used for hypothesis testing
and is critical in the
interpretation of results from
quantitative research studies.
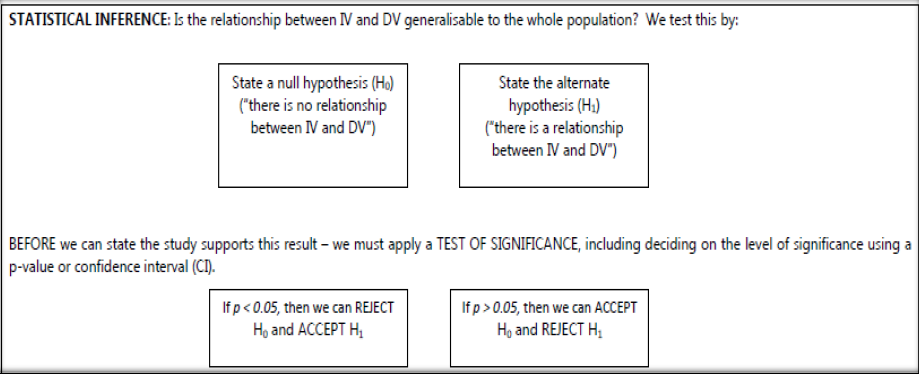
- used to see if an association between two (or more)
variables is statistically significant.
- determines the probability of obtaining the same or
more extreme result that the one actually observed
from chance alone (i.e. assuming the null
hypothesis is true);
- generally (but arbitrarily) considered significant if p ≤ 0.05 (i.e.
the p-value is less than or equal, to 0.05).
- generally (but arbitrarily) considered significant if p ≤ 0.05 (i.e.
the p-value is less than or equal, to 0.05).
- determines the probability of obtaining the same or
more extreme result that the one actually observed
from chance alone (i.e. assuming the null
hypothesis is true);
- used to see if an association between two (or more)
variables is statistically significant.
- routinely report the results of studies with p-values.
- If they do not have some test of significance
- you cannot really interpret
whether or not the results are
actually “true” or of any use at
all.
- you cannot really interpret
whether or not the results are
actually “true” or of any use at
all.
- results are commonly summarized by a statistical test
- and associated p-values or confidence intervals, and a
decision about the significance of the result is based on
either one of them (they provide similar information)
- and associated p-values or confidence intervals, and a
decision about the significance of the result is based on
either one of them (they provide similar information)
- reader decides if evidence is strong enough to believe.
- study was designed according to good
scientific practice, the strength of the
evidence is contained in the p-value.
- important for the reader to know what the p-value is saying.
- If not due to chance, the association is likely to be real
and the results can be generalised to the whole
population.
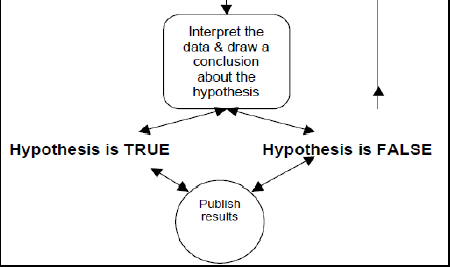
- the conclusion drawn about the hypothesis
- the conclusion drawn about the hypothesis
- The process of applying a test of
significance is also called
HYPOTHESIS TESTING
- this results in a decision to reject, or not, the NULL
HYPOTHESIS.
- this results in a decision to reject, or not, the NULL
HYPOTHESIS.
- GOLDEN RULES
- p ≤ 0.05
- the result is statistically significant
- the result is statistically significant
- p > 0.05
- the result is NOT statistically different
- the result is NOT statistically different
- p ≤ 0.05
Media attachments
Want to create your own Mind Maps for free with GoConqr? Learn more.