210934
Description
Mind Map by shirley.ha, updated more than 1 year ago
|
|
Created by shirley.ha
over 12 years ago
|
|
P-values e.g
- 1. using an RCT as an example to demonstrate hypothesis testing
- Imagine an RCT is conducted to compare two treatments
- an active drug for Irritable Bowel Syndrome (IBS
- and a placebo
- All conditions are identical apart from
distribution of the actual drug to the
intervention group, and the placebo to the
control group.
- an active drug for Irritable Bowel Syndrome (IBS
- it is reasonable for the null and alternative hypotheses to state:
- 1. H0 = the mean (ie IBS ‘score’) of the two
groups are not different
- 2. H1 = the mean (ie IBS ‘score’) of the
two groups are statistically significantly
different
- The p-value determines whether we accept or reject the
null hypothesis.
- 1. H0 = the mean (ie IBS ‘score’) of the two
groups are not different
- Imagine an RCT is conducted to compare two treatments
- 2.researchers need to statistically demonstrate
that the difference obtained between the effect of
the drug for IBS compared.
- that of the placebo is either due to chance, or that a
statistically significant difference actually exists.
- the null hypothesis (no difference) can be
ruled out,
- then the differences between the drug and
placebo is most likely due to the
effectiveness of the drug itself.
- then the differences between the drug and
placebo is most likely due to the
effectiveness of the drug itself.
- A
- The researchers decide what
significance level to use
- what cut-off point will decide significance in the
test they use (in this case the cut off for the
p-value)
- The most commonly used level
of significance is 0.05.
- any test resulting in a p-value equal to, or
less than 0.05 would be significant.
- would reject the null hypothesis in favour of the
alternative hypothesis
- would reject the null hypothesis in favour of the
alternative hypothesis
- any test resulting in a p-value equal to, or
less than 0.05 would be significant.
- The most commonly used level
of significance is 0.05.
- what cut-off point will decide significance in the
test they use (in this case the cut off for the
p-value)
- The researchers decide what
significance level to use
- B
- P-values equal to or less than 0.05
- suggest that the observed associations could be
found by chance in 5 out of 100 samples
- That is, the results of 5 in 100 samples are due to chance
occurrence.
- That is, the results of 5 in 100 samples are due to chance
occurrence.
- suggest that the observed associations could be
found by chance in 5 out of 100 samples
- P-values equal to or less than 0.05
- that of the placebo is either due to chance, or that a
statistically significant difference actually exists.
- GOLDEN RULES
- We can REJECT the null hypothesis if p ≤ 0.05.
- We must ACCEPT the null hypothesis if p > 0.05.
- We can REJECT the null hypothesis if p ≤ 0.05.
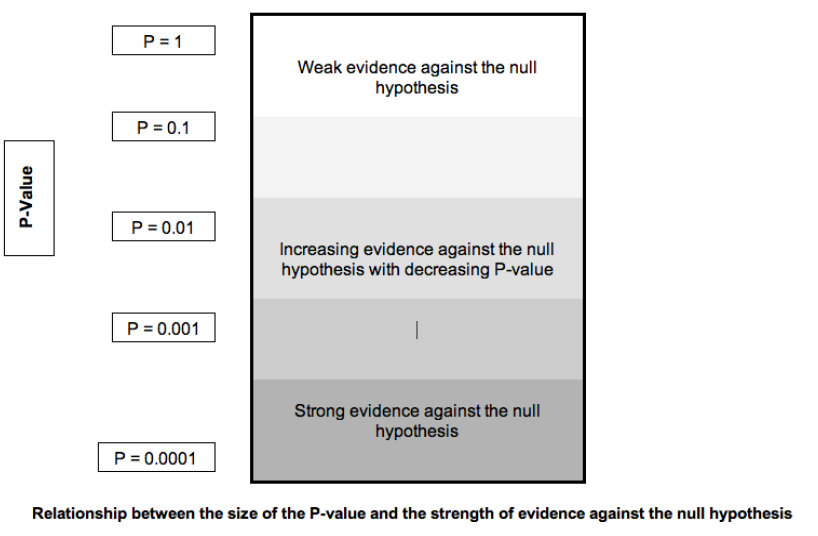
- do not simply provide you with a “Yes” or “No” answer
- provide a sense of the strength of the
evidence against the null hypothesis
- provide a sense of the strength of the
evidence against the null hypothesis
- lower the p-value, the stronger the evidence
Media attachments
Want to create your own Mind Maps for free with GoConqr? Learn more.