
Mind map
1.3 Processing and analysing data
Map content
1.3 Processing and analysing data
PRACTICLE REPORTS
- A report is basically the way scientist display their observations and experiment that they have conducted. A report includes:
- Heading & Purpose)- A heading is the title that tells you what the report is about. The purpose is briefly what you are trying to do/ achieve.
- Hypothesis & Materials)- The hypothesis is an educated guess on what might happen in the experiment, Materials are the list of thing you need in order to conduct the experiment
- Procedure & Results)- The procedure is the method that you used to do the experiment. The steps you needed to take to get a result. The result is the summary of the product you left with
- Review & Resource List)- The review is the overall summary f the experiment you have conducted. It can include whether you hypothesis was right or not. The resource list is if you have used any secondary data, you need to reference it at the end.
- Procedure & Results)- The procedure is the method that you used to do the experiment. The steps you needed to take to get a result. The result is the summary of the product you left with
- Hypothesis & Materials)- The hypothesis is an educated guess on what might happen in the experiment, Materials are the list of thing you need in order to conduct the experiment
- Heading & Purpose)- A heading is the title that tells you what the report is about. The purpose is briefly what you are trying to do/ achieve.
- A report is basically the way scientist display their observations and experiment that they have conducted. A report includes:
GRAPHING DATA
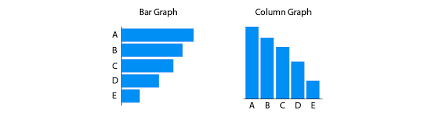
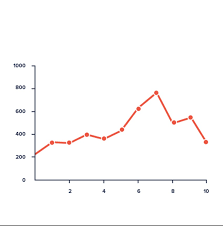
- Four types of Graphing data. 1- Bar Graphs, 2- Pie Charts, 3- Line Graph, 4-Column Graph
The main purpose of graphing data is to make the data more clear. Easier to read.
Images and files in the map

Information
- Description
- Mind Map on 1.3 Processing and analysing data, created by Rokaya Alshaibani on 27/07/2020.
- Created by
- Rokaya Alshaibani
- Views
- 2
- Rating