
Mind map
Energy

Map content
Energy
Energy Issues
- Types of energy
- Non-renewable energy resources
- Resources that have been built up, or evolved over time.
- Also known as stock resources
- These types of energy resources have a 'reserve' and cannot be used without depleting the stock, due to formation being slow
- Examples of this type of energy include
- Oil
- Coal
- Gas
- Renewable energy resources
- Also known as flow/stock resources
- Resources that have a natural rate of avalibility
- These sources of energy yield a continuous flow, that can be consumed at anytime
- Renewable energy are spilt into 2 different areas
- Critical
- Sustainable energy resources which require management.
- e.g. Forests, plants, animal waste
- Non-critical
- Everlasting resources
- e.g. Tides, Waves, Wind, Solar energy
- Critical
- Non-renewable energy resources
- Energy Demands
- Shell's future plans
- http://www.shell.co.uk/energy-and-innovation/the-energy-future.html
- By 2050 energy demand is expected to double
- Shell's future plans
- Types of energy
Worlds Energy Mix
- Link to interactive map, on the worlds energy mix as well as Europe's energy usage
- http://environment.nationalgeographic.com/environment/energy/great-energy-challenge/world-electricity-mix/ - Global energy mix
- http://energy.publicdata.eu/ee/vis.html - Europes energy usage
- Currently, all the fossil fuels being used means that there is a lot of CO2 emmisons
- http://environment.nationalgeographic.com/environment/energy/great-energy-challenge/global-footprints/
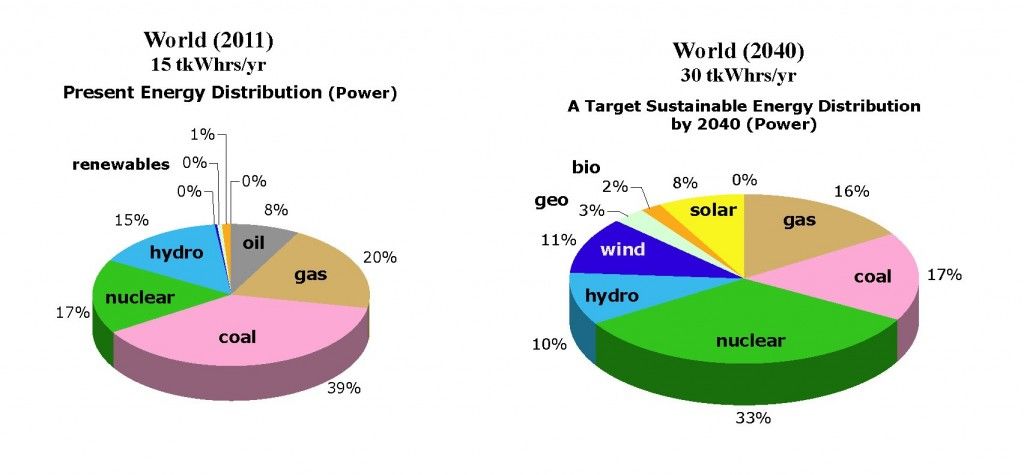
- Countries gather their energy from a variety of sources, as one source may not be able to supply their energy needs
- Currently the global energy mix means that 87% of energy resources come from fossil fuels
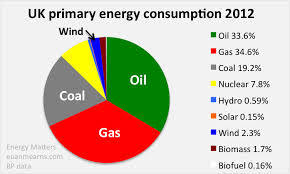
- In the UKs the energy mix:
- 70% is made of fossil fuels
- Renewable energy is still below the UK average of 6%
- Coal use has fallen by 40%
- Most likely caused by coal mines closing in the 1980s
- Link to interactive map, on the worlds energy mix as well as Europe's energy usage
Images and files in the map
Information
- Description
- A Level Geography (Energy) Mind Map on Energy, created by Phoebe Fletcher on 21/04/2015.
- Created by
- Phoebe Fletcher
- Views
- 124
- Tags
- Rating