
Mind map
Information, events and types
Map content
Information, events and types
Methods of data collection
- One of the most widely used types of data collection, proven and effective. Questionnaires can be used to find out how satisfied participants are with a course, what knowledge they have acquired and whether they use it. Questionnaires with closed questions can be evaluated quickly, even in large numbers; questionnaires with open questions usually provide useful additional information.
- Important information for impact analysis can be found in many internal and external documents. Internal documents are project concepts, reports and protocols; in them you can find goals, results, deviations. External documents are studies, surveys or official statistics; these are especially interesting for the needs and environment analysis and as a benchmark for comparison.
Types of graphs
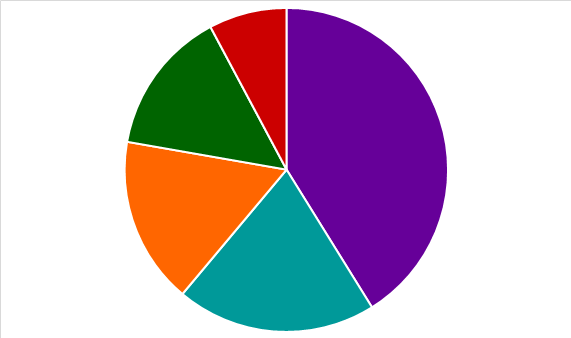
- Pie charts are a popular graphical representation form to show the division of a whole. For the graphical representation of categorical data, one uses diagram forms that allow the clearest possible representation of relative proportions. All proportions must add up to 100%. The relative proportion of the individual components should be immediately visually recognizable. So that these relative proportions can be classified in terms of size at a glance, not too many categories should be used. If they are too numerous, smaller categories should be grouped together if possible. Otherwise, presentation in the form of a table is more suitable.
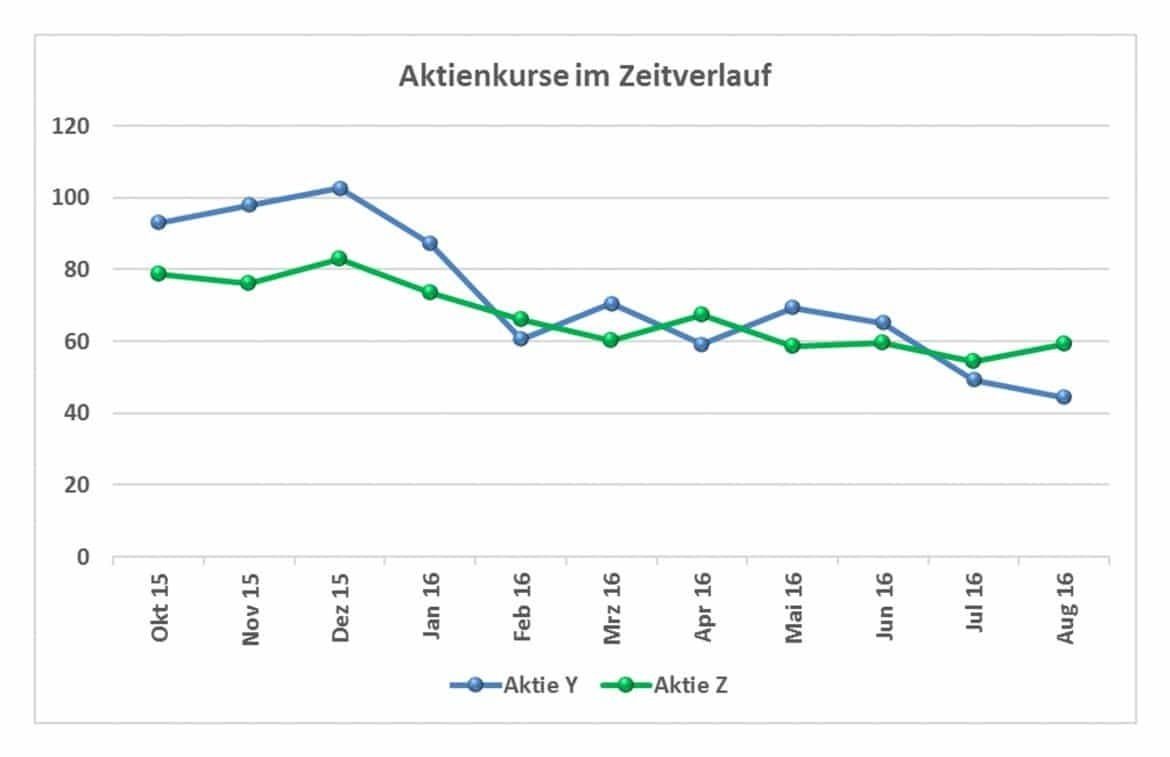
- Line charts are particularly suitable for the representation of developments, especially when the development of two or more populations is compared with each other. The fine lines make it possible to accommodate information on several objects of investigation in a very small space, as can be seen in the following fictitious example, which shows how the acceptance of the admission of a further country to the European Union changed in different countries.
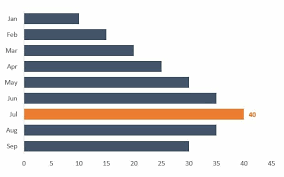
- Simple bar charts, because they start from the same zero point, are very well suited to make comparatively even the smallest differences between sub-areas recognizable. They are the best form of representation for presenting the results of questions with multiple answers, for example.
Frequency distribution tables
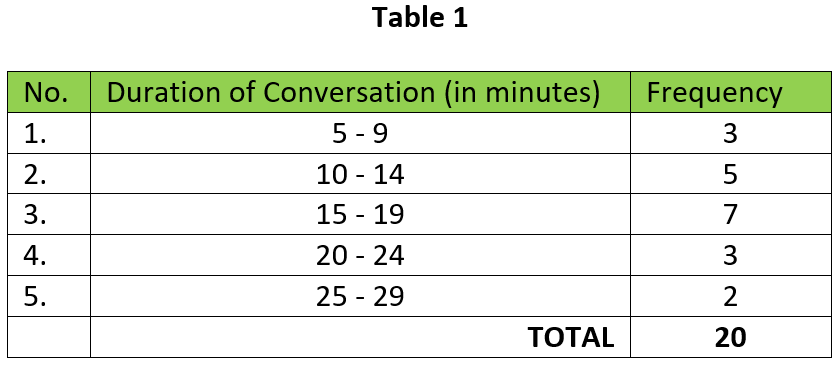
- Frequency tables are created when you want to display the absolute and relative frequencies of the values of your variables or characteristics. Thus, a frequency table for your data shows you how often each characteristic occurs. A frequency table for the variable gender, for example, shows how often the characteristics male and female occur in the sample.
Median
- The value that lies exactly in the middle of a data distribution is called the median or central value. For an even number of individual data, the median is half the sum of the two values lying in the middle.
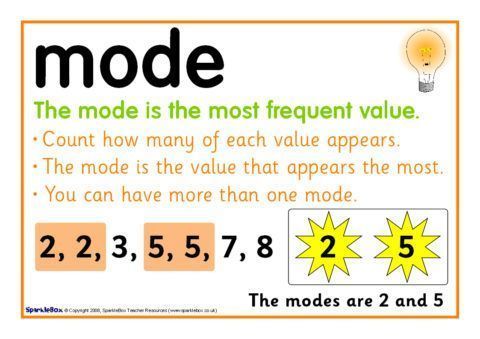
Mode
- The mode of a data series is the characteristic or value with the highest frequency.There can also be multiple modes if two or more different characteristics occur equally often most frequently.
Standard deviation and variance
- Variance is a measure of dispersion that characterizes the distribution of values around the mean. It is the square of the standard deviation. The variance is calculated by dividing the sum of squared deviations of all measured values from the arithmetic mean by the number of measured values.
Simple and weighted averages
- The weighted average is calculated by multiplying the number of products by the weighting. Then you make the sum over the products and the number of weighting. Now divide the sum of the products by the number to get the weighted average.
Quartiles and box plots
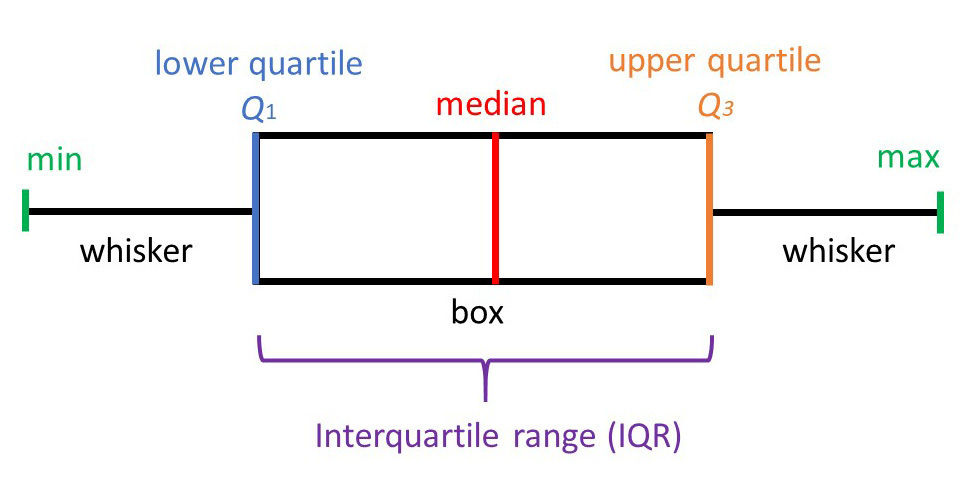
- Quartiles belong to the position parameters in descriptive statistics. Translated from Latin, "quartile" means "quarter value" and is a positional measure for statistical data. The median is the middle quartile or the 2nd quartile. The median divides an ordered data set into two equal parts. The lower of the two parts separated by the median is divided by the lower quartile, the 1st quartile, and the upper by the upper quartile, the 3rd quartile. , again divided into equal parts. The quartiles divide an ordered data set, e.g. of samples, thus into four equal parts.
Events and types
- Incompatible Events Addition Rule: P(E $\bigcup$ F) = P(E) + P(F) The calculation rule states that if the probability of two events that do not involve common outcomes are added together, this corresponds to the event that either P(E) or P(F) occurs.
Probability of an event
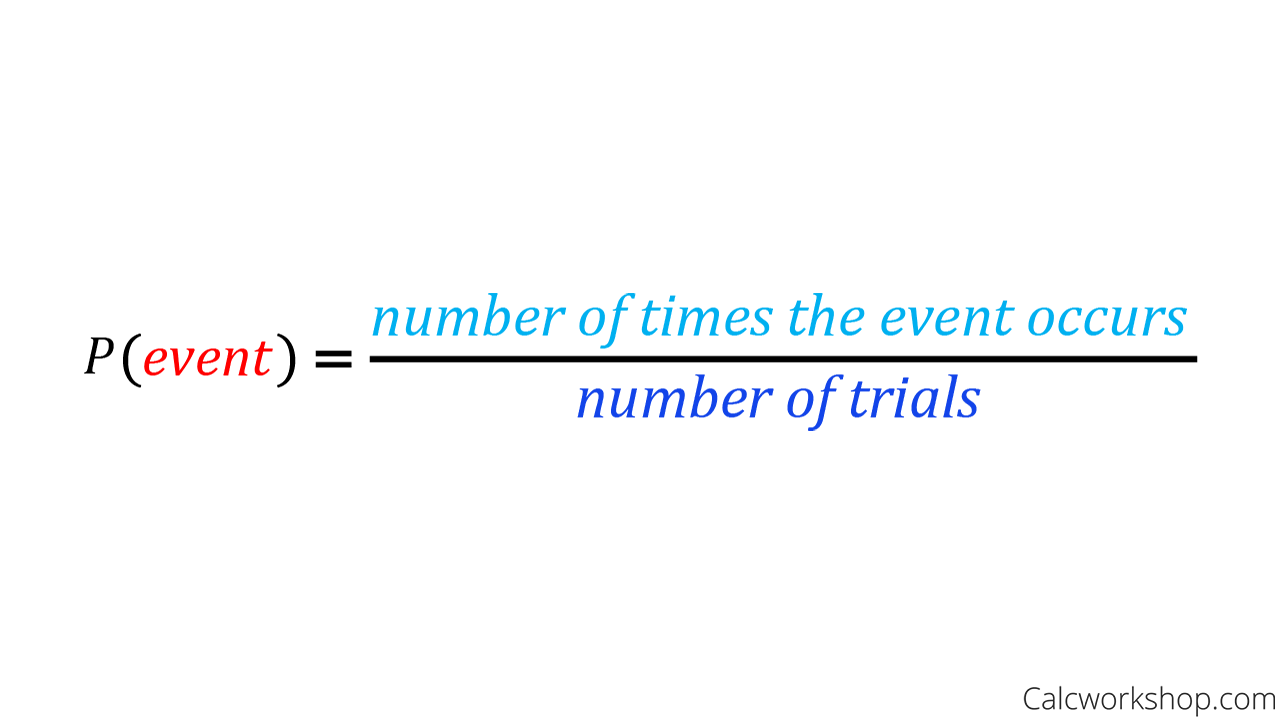
- The probability of an event can be calculated by dividing the number of outcomes in which the event you are looking for occurs by the number of possible outcomes.
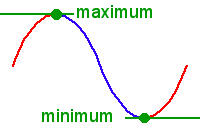
Minimum, maximum
- The largest value of a data series is the maximum. If all values of a data series are sorted in ascending order, the value on the far left is the smallest value, i.e. the minimum, and the value on the far right is the largest value, which is the maximum.
Conditional probabilities
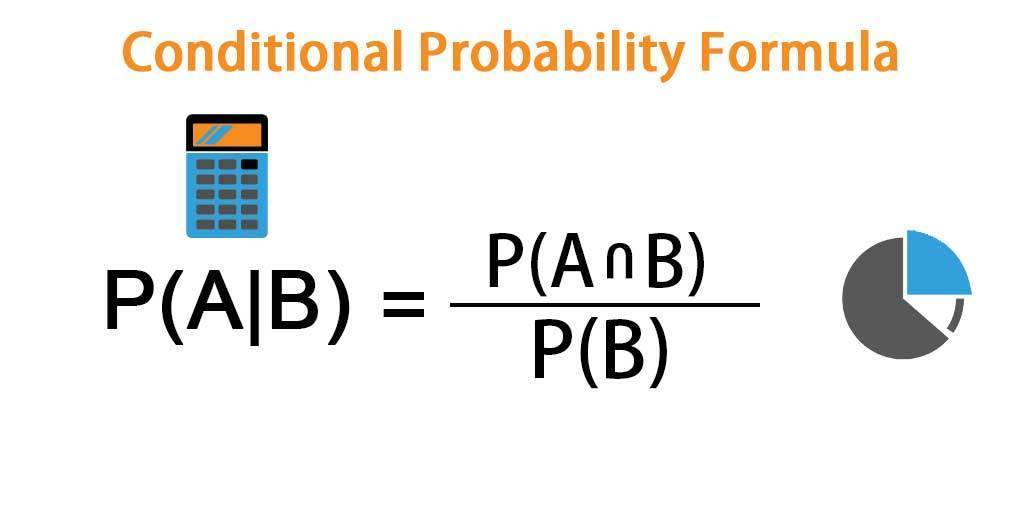
- Conditional probability is the probability of occurrence of an event A under the condition that the occurrence of another event B is already known. It is written as P.
Tree diagrams
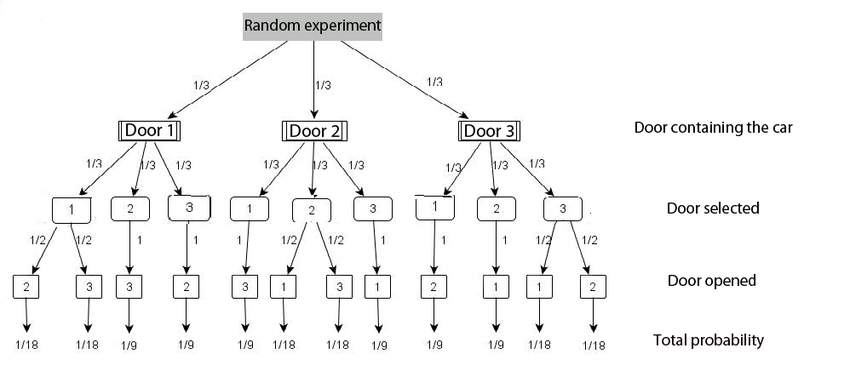
- A tree diagram is a graphical representation that shows the relationships between individual elements of a network by means of connecting lines. The name is derived from the branched structure of these representations.
Images and files in the map

Information
- Description
- Mind Map on Information, events and types, created by Michel Krämer on 02/09/2021.
- Created by
- Michel Krämer
- Views
- 6
- Rating