
Mind map
Demographic Trends
Map content
Demographic Trends
Birth Rates
- Trends
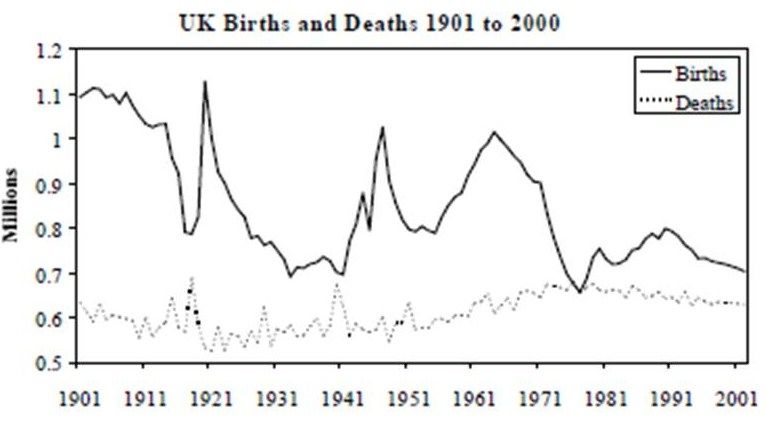
- The Birth rate – the number of live births per 1000 of the population per year originally was fairly high due to the fact that child labour was legal in Victorian England, and that because of the high risk of death in childbirth due to infection ect. The more children you conceived, the higher the chance that you would get a child this is a rise in the TMF (total fraternity rate). In the early 1900’s the birth rate was 28.7 births per 1000. Since the start of the 20th century the birth rate has been in long term decline; in 2007 the birthrate was only 10.7.
- The fall in birth rate can be explained by many reasons, one is that due to woman’s rights, the position of women has greatly increased, meaning that the old stereotype stating that woman must look after the house and children ect is shunned; as some women may not want children due to increased educational opportunities and the fact that if they go on maternity leave they are at risk of losing their job – or having a large deduction of wages. If woman get pregnant accidently, it is now easier and more socially acceptable to get access to abortions, and contraception – meaning that woman have more control of their fertility. The fall in the birth rate is also because of the decline in the infant mortality rate (IMR), falling IMR means a fall in the birth rate because more children are surviving, so parents to not need to try again.
- Infant mortality rate- the number of deaths of babies in their first year of life per 1,000 live births per year.
- Ageing population- Is one in which the average age is getting higher, with a greater proportion of the population over retirement age, and a smaller proportion of young people.
- The Birth rate – the number of live births per 1000 of the population per year originally was fairly high due to the fact that child labour was legal in Victorian England, and that because of the high risk of death in childbirth due to infection ect. The more children you conceived, the higher the chance that you would get a child this is a rise in the TMF (total fraternity rate). In the early 1900’s the birth rate was 28.7 births per 1000. Since the start of the 20th century the birth rate has been in long term decline; in 2007 the birthrate was only 10.7.
- Effects on families/on societies
- More children which leads to more money being spent on them, creates larger families and therfore more strain on the parents.
- The crude birth rate in Hong Kong has dropped significantly from 35.0 per 1,000 population in 1961 to 7.0 per 1,000 population in 2003, then raised to 13.5 per 1,000 population in 2011, and dropped to 8.6 per 1,000 population in 2014.
- Trends
Death Rates
- Trends
- Death rate (mortality rate)- the number of deaths per 1,000 of the population per year.
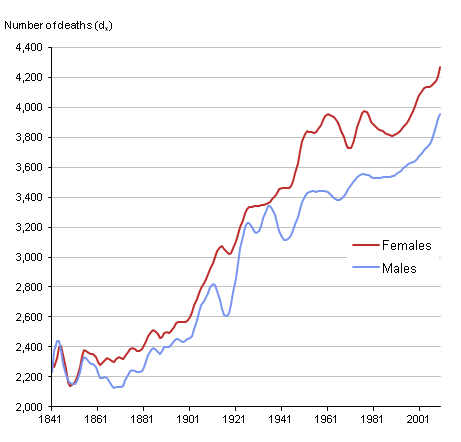
- The death rate – the number of deaths per 1000 of the population per year is another major demographic trend. In the 1900’s the death rate was fairly high, at 19 deaths per 1000 of the population this can be explained by the lack of medical knowledge at the time, and because of the number of deaths from infectious diseases such as typhoid or tuberculosis; most of these occurred in the young which contributed to the death rate. The number of infectious diseases declined throughout the century thanks to social factors, such as better nutrition, housing and sanitation, and also thanks to medical breakthroughs such as the discovery of penicillin by Fleming and the distribution of it by Florey and Chain during WWII. Factors such as these lead to a decrease of the death rate, and in 2007 the death rate is at 10 per 1000. The lower death rate means a higher life expectancy – meaning people live longer.
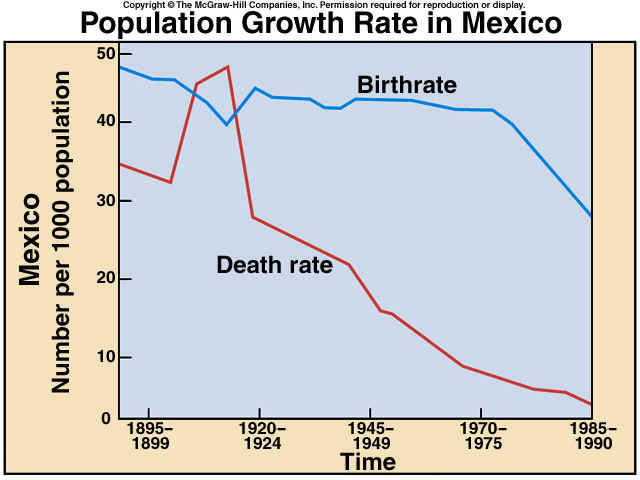
- Crude death rate indicates the number of deaths occurring during the year, per 1,000 population estimated at midyear. Subtracting the crude death rate from the crude birth rate provides the rate of natural increase, which is equal to the rate of population change in the absence of migration
- Death rates in mexico are increasingly in decline and this can be shown in this graph
- Trends
Change in family size
- How things have changed?
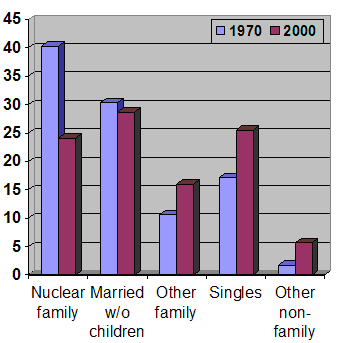
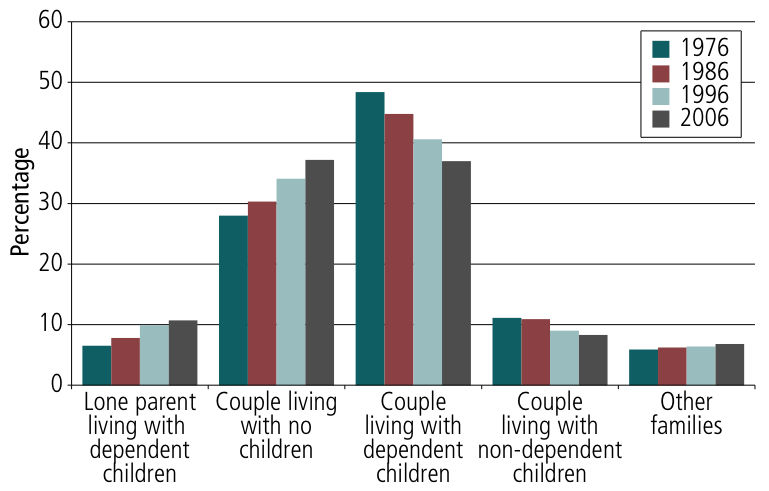
- Over the past 40 years people, generally, tended to marry later and didn’t consider creating the family as the most important thing in their life. Also more and more people choose living alone rather than with family and have freedom. And if before living alone gave negative status for women as they failed in finding partners, now views have changed and it is not blame to be alone.
- Main causes of an increase in family diversity are changing in attitudes that is how people now define the ideal family life, increased opportunities in going to University for everyone made people be more aimed in making their own career and be more independent; from 1967 contraception became more reliable and available for all women and sexual relationships became not only the way of social reproduction but also the expression of love.
- Also family diversity has increased due to changes in expectations from marriage and as Fletcher said, now people place higher values on marriage. The Divorce act 1969 made it easier for people to divorce and they didn’t have to prove guilty of their partners. Beck and Beck-Gernsteim argued that our society is characterized by increased individualization, women don’t need to rely on their husbands anymore and they can achieve the same statuses with them if not higher.
- Main causes of an increase in family diversity are changing in attitudes that is how people now define the ideal family life, increased opportunities in going to University for everyone made people be more aimed in making their own career and be more independent; from 1967 contraception became more reliable and available for all women and sexual relationships became not only the way of social reproduction but also the expression of love.
- However in China things have changed drastically as the most common family type in Chinese cities was once the nuclear family. But while it accounted for 48 per cent of families in urban areas in 1997, that figure has shrunk to 37 per cent today, the survey shows. Covering more than 1,000 households in Beijing, Shanghai, Guangzhou and Wuhan, the survey found that the number of one-person and linear or generational families are on the rise from six years ago.
- Over the past 40 years people, generally, tended to marry later and didn’t consider creating the family as the most important thing in their life. Also more and more people choose living alone rather than with family and have freedom. And if before living alone gave negative status for women as they failed in finding partners, now views have changed and it is not blame to be alone.
- Nuclear family- two generations:parents and children living in the same household
- Extended family- all kin including and beyond the nuclear family
- Classic extended family- An extended family sharing the same household or living near each other
- Lone parent- lone parent with dependent children
- How things have changed?
Images and files in the map
Information
- Description
- Mind Map on Demographic Trends, created by Jacob Rouse on 08/12/2015.
- Created by
- Jacob Rouse
- Views
- 5
- Rating