
Mind map
Ratio Analysis
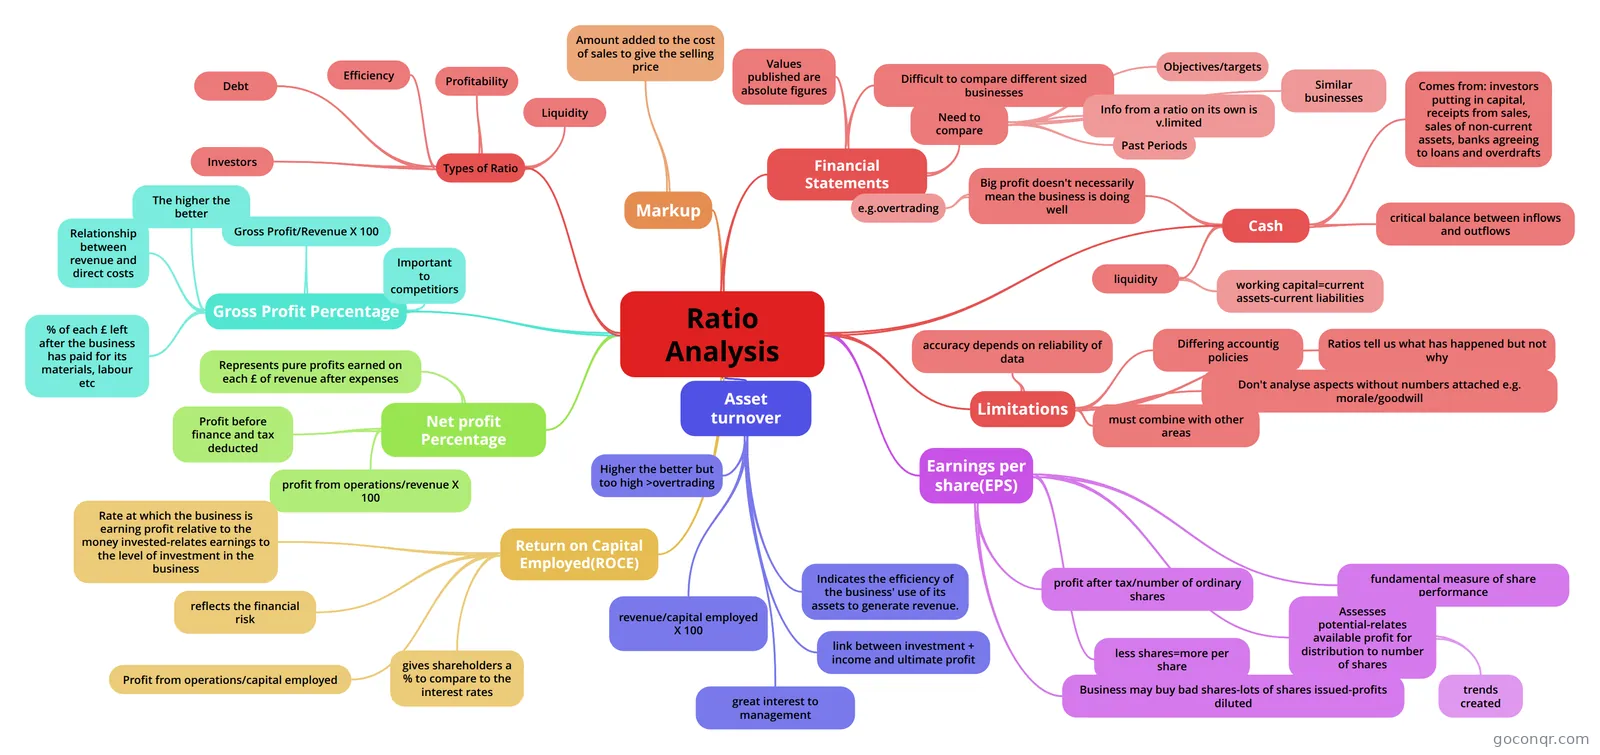
Mind map: ratio analysis
Map content
Ratio Analysis
Financial Statements
- Values published are absolute figures
- Difficult to compare different sized businesses
- Need to compare
- Info from a ratio on its own is v.limited
- Past Periods
- Similar businesses
- Objectives/targets
Types of Ratio
- Profitability
- Liquidity
- Efficiency
- Debt
- Investors
Gross Profit Percentage
- Gross Profit = Revenue-Cost of sales
- Gross Profit/Revenue X 100
- Relationship between revenue and direct costs
- % of each £ left after the business has paid for its materials, labour etc
- The higher the better
- Important to competitiors
Cash
- Comes from: investors putting in capital, receipts from sales, sales of non-current assets, banks agreeing to loans and overdrafts
- critical balance between inflows and outflows
- Big profit doesn't necessarily mean the business is doing well
- e.g.overtrading
- This is when a business invests too much in non-current assets(often during rapid expansion) and not enough is kept for day-to-day trading and emergencies.
- e.g.overtrading
- liquidity
- Good=business has lots of cash/near cash assets compared to bills
- working capital=current assets-current liabilities
Markup
- Amount added to the cost of sales to give the selling price
Net profit Percentage
- profit from operations/revenue X 100
- Profit before finance and tax deducted
- Represents pure profits earned on each £ of revenue after expenses
Return on Capital Employed(ROCE)
- Rate at which the business is earning profit relative to the money invested-relates earnings to the level of investment in the business
- Profit from operations/capital employed
- Capital employed= shareholder's funds + long term liabilities
- reflects the financial risk
- gives shareholders a % to compare to the interest rates
Asset turnover
- revenue/capital employed X 100
- link between investment + income and ultimate profit
- Indicates the efficiency of the business' use of its assets to generate revenue.
- great interest to management
- Higher the better but too high >overtrading
Earnings per share(EPS)
- profit after tax/number of ordinary shares
- profit after tax=all costs deducted
- fundamental measure of share performance
- Assesses potential-relates available profit for distribution to number of shares
- trends created
- less shares=more per share
- Business may buy bad shares-lots of shares issued-profits diluted
- profit after tax/number of ordinary shares
Limitations
- must combine with other areas
- accuracy depends on reliability of data
- Differing accountig policies
- Ratios tell us what has happened but not why
- Don't analyse aspects without numbers attached e.g. morale/goodwill
Information
- Description
- Mind Map on Ratio Analysis, created by megan.s on 19/12/2013.
- Created by
- megan.s
- Views
- 428
- Rating