
Mind map
Week4
Map content
Week4
Statistical testing
- A statistical test is run to determine if the observed differences between the compared estimates (e.g., means, difference-in-means, proportions, etc.) are statistically significant. • In other words, we want to know whether the observed difference between the group estimates is different than what would be expected by chance alone.
- Before you decide which statistical test to use, recall the following: 1) the scale of the dependent variable (e.g., categorical, ordinal or continuous), 2) the distribution of the dependent variable (e.g., normal distribution, t distribution, F distribution, chi-square distribution, etc.), 3) the number of dependent (what you are measuring) and independent variables, and 4) the nature of compared groups (e.g., matched or unmatched).
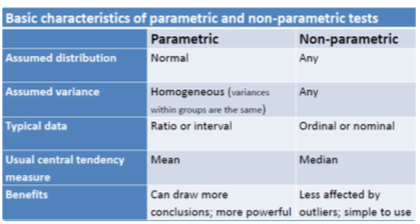
Parametric tests:
- Test hypotheses based on the assumption that the samples come from populations that are normally distributed
- Parametric statistical tests assume that there is homogeneity of variance (variances within groups are the same).
- The level of measurement for parametric tests is assumed to be interval, or ratio.
Non parametric: when conditions stated in previous slide are not met, parametric tests cannot be used.
- When to use a non-parametric test? • When the distribution of the outcome variable is not Normal. Normality can be assessed by drawing a histogram or running tests such as the Shapiro-Wilk test • Sample is small • The outcome variable is ordinal or rank or nominal • Outliers present • Tool collecting data is inaccurate – not accurate enough to detect beyond some limits
differences between groups-independent.
- Indepdnant t test: used to determine if there is a difference between the means of two independent grapes on a continuous dependant variable.
- with this test you are trying to find if the difference between the means is as a result of sampling variation or if a 'real' difference exists in the population you want to infer to.
- Mann-Whitney U test: is a ran based non-paremtirc test that can be used to determine the difference between two the medians of two groups on a continuous or ordinal scale.
- this test is helpful if you don't have normally distributed date or an ordinal dependant variable.
- Indepdnant t test: used to determine if there is a difference between the means of two independent grapes on a continuous dependant variable.
Interpreting t results
- Scenario: 28 children with CP were randomly divided into two groups. Neurodevelopmental therapy was given to the first group (n=15) and compared to a control group (n=13). All children were assessed using the Gross Motor Function Measure (GMFM) at baseline and post-treatment at 3 months
- an independent sample t-test was used for comparison of the means between the two groups.
Man-Whitney U test.
- this test is based on the ranking of measurements from two samples to estimate whether the samples are from the same population - no assumptions are made about the distribution of the measurements in either group.
- e.g. do babies who have an infection stay longer in the NICU?
Differences between groups-paired.
- Paired T test Used to test if the mean difference between paired observations is statistically significantly different from 0. • Trick – to check normality for this test it must be done on the difference variable. i.e. outcome at time 1 – outcome at time 2
- Wilcoxon signed-rank testAlso known as the Wilcoxon matched pairs test and is used when the normality of the differences is concerning and the sample size is small. • In this test it looks at the absolute differences between the paired scores and ranks them and provides the median and the 25th and 75th percentiles.
Images and files in the map
Information
- Description
- Mind Map on Week4, created by Tegan Rance on 19/10/2016.
- Created by
- Tegan Rance
- Views
- 0
- Rating