
Mind map
Statistics 2
Map content
Statistics 2
The Binomial Distribution
- X~B(n,p)
- P(X«x)
- P(X=r) = ⁿCᵣ x pʳ x qᵍ
- where g is n-r
- Conditions
- 1) There must be a fixed number (n) of trials
- 2) The trials must be independent
- 3) The trials must only have two outcomes ( success and failure )
- 4) The probability (p) of success must remain constant for each trial
- E(x) = n x p
- σ² = np(1-p)
- σ = √np(1-p)
The Poisson Distribution
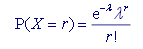
- X~Po(λ)
- Conditions
- 1) Events occur singly in a continuous interval of space or time
- 2) Events occur independently of one another
- 3) Events occur at a constant rate
- The rate of... indicates the Poisson distribution
- E(X) = λ
- Var(X) = λ
Approximations
- Using the Poisson Distribution as an approximation to the Binomial Distribution
- If X~B(n,p) where n>50 and p<0.1 then X~Po(λ) where λ = np
- Using the Normal Distribution as an approximation to the Binomial Distribution
- when n is large and p is not close to 0 or 1
- If X~B(n,p) then X~N(np,npq)
- This works best if n>10 and p=1/2
- Continuity Correction
- P(X=3) = P(2.5<X<3.5)
- P(X<4) = P(X<3.5)
- P(X«4) = P(X<4.5)
- P(X»4) = P(X>3.5)
- P(X>4) = P(X>4.5)
- when n is large and p is not close to 0 or 1
- Using the Normal Distribution as an approximation to the Poisson Distribution
- When λ is quite large
- If X~Po(λ) then X~N(λ,λ)
- Using the Poisson Distribution as an approximation to the Binomial Distribution
Continuous Random Variables
- The area under the graph of a continuous random variable is 1
- To be a pdf f(x)»0 for all values of x in the given range
- ₐ⌠ᵇ f(x) dx = 1
- The Cumulative Distribution Function
- F(x) = ₐ⌠ˣ f(x) dx where a is the lower limit
- 0«F(x)«1
- f(x) = d F(x)/dx
- The median: F(m) = 0.5
- F(LQ) = 0.25
- F(UQ) = 0.75
- The Mode: f'(x) = 0
- The mode is the maximum value of the PDF
- E(X) = ⌠xf(x) dx
- E(aX + b) = aE(X) + b
- Var(X) = ⌠x²f(x) dx - μ²
- Var(aX + b) = a²Var(X)
The Continuous Uniform Distribution
- X~U(α, β)
- f(x) = 1/β-α
- E(X) = 1/2 (α + β)
- Var(X) = 1/12 (β - α)²
Hypothesis Testing
- A hypothesis is a statement made about the value of a population parameter that we wish to test by collecting evidence in the form of a sample
- The null hypothesis, Ho is the hypothesis that we assume to be correct unless proved otherwise
- The alternative hypothesis tells us about the value of the population parameter if our assumption is shown to be wrong
- The critical region is the range of values of the test statistic that would lead to rejection of Ho
- The significance level is the probability of rejecting Ho when it is true
- The actual significance level of a test is the probability of rejecting Ho
- A hypothesis test is a mathematical procedure to examine a value of a population parameter proposed by the null hypothesis compared to the alternative hypothesis
Images and files in the map
Information
- Description
- Mind Map on Statistics 2, created by abbeycropper on 17/04/2014.
- Created by
- abbeycropper
- Views
- 12
- Rating