
Mind map
data analysis II (inferential statistics)
Map content
data analysis II (inferential statistics)
Sampling distribution
- Normal distribution
- 1.Normal distributions are symmetric around their mean. 2.The mean, median, and mode of a normal distribution are equal. 3.The area under the normal curve is equal to 1.0.
- 4. Normal distributions are denser in the center and less dense in the tails. 5. Normal distributions are defined by two parameters, the mean and the standard deviation. 6. 68% of the area of a normal distribution is within +1 and -1 standard deviation of the mean.
- 7. Approximately 95% of the area of a normal distribution is within +2 and -2 standard deviations of the mean. 8. 99.7% of data fall under +3 and -3 standard deviations of the mean. (from David. M. Lane)
- Rmb to see table, week 9 slide 5
- what is it? a probability distribution of all possible values of a statistic that would occur if all possible samples of a fixed size from a given population were taken.
- Central limit theorum
- Sampling distributions of any statistics will be normal or nearly normal if the sample size is LARGE enough. Thus, sample mean will be approx normally distributed for a large sample.
- fyi sample size will usually be 1% of pop or lesser
- mean of sampling dist. will also be equal to the pop mean
- curve will be symmetrical, centered abt its mean, with its spread determined by its Standard deviation. (this is called SE in sampling dist.)
- see diagram slide 15. Normal distribution of sample means 68% of sample means fall within +/- one SE 95% of sample means fall within +/- two SE (standard error)
- Sampling distributions of any statistics will be normal or nearly normal if the sample size is LARGE enough. Thus, sample mean will be approx normally distributed for a large sample.
- Normal distribution
Research qn vs Research hypothesis
- RQ: Exploratory. Does not predict an outcome. Discovers general indications.
- RH: Confirmatory. Predict an outcome. Statistical testing.
- shld be compatible w current knowledge (based on exsiting theory or observations). logically consistent. succinct. testable.
To what extent is our sample statistic close to the true value of population?
- Sampling error
- The degree to which measurements obtained from a sample (statistic) differ from the measurements that would be obtained from the population (parameter)
- Confidence level
- Cl = a degree of certainty (%) that the results will fall within a range of values. -We never know true parameter, BUT….. -we know that 68.3 % of sample means lie within one standard error (deviation) of the true population mean
- -In other words, we can say that at 68.3% confidence level, we can infer that the true population mean lies within x ± 1 (SE))
- We can be 68.3% confident that the true pop mean lies within x ± 1 (SE))
- -In other words, we can say that at 68.3% confidence level, we can infer that the true population mean lies within x ± 1 (SE))
- Cl = a degree of certainty (%) that the results will fall within a range of values. -We never know true parameter, BUT….. -we know that 68.3 % of sample means lie within one standard error (deviation) of the true population mean
- confidence level and confidence interval. helps to det. accuracy of results
- SE decreases as the sample size increases
- low sampling error indicates less variability or range in the sampling distribution
- Confidence interval (margin of error) is a plus-or-minus percentage that is a range within the confidence level. If 3% CI is used and 50% of the sample gives a particular answer for a question, the actual result for that question falls between 47% and 53% (50±3).
- statistic
- The summary description of a variable in a sample used to estimate a population parameter (known)
- parameter
- true value of population (unknown), but estimated from the sample
- Sampling distribution: If we took another random sample of 30 Individuals from the same population, we would obtain another estimate of average height of Singaporeans. If more random samples were selected, the values for x bar that are close to the population mean would become more numerous than the values of x bar that are greatly different from |U. Repeated samples from the same population will give different sample means (sampling distribution). If this process is repeated an infinite number of times and each mean were placed on a frequency curve, the curve would form a sampling distribution (becomes more normal, steeper.)
- Sampling error
Research hypothesis vs null hypothesis
- null hypothesis
- in the statistics, the maximum acceptable probability that the effect is due to random variability in the data rather than the potential cause being investigated. AKA, (states that statistical differences r due to chance or random error.)
- region of rejection traditional mtd. if sample stat falls between far right n left regions, rej ho.
- null hypothesis
Testing hypothesis
- Reject null hypothesis
- Region of rejection
- p value
- The probability that the test statistic equals the observed value or a more extreme value under the assumption that the null hypothesis is true.
- conclude. is the observed diff between the 2 sample means statistically significant? is H1 supported? p< 0.05?
- p value also gives us some idea of the strength of evidence against Ho.
- The probability that the test statistic equals the observed value or a more extreme value under the assumption that the null hypothesis is true.
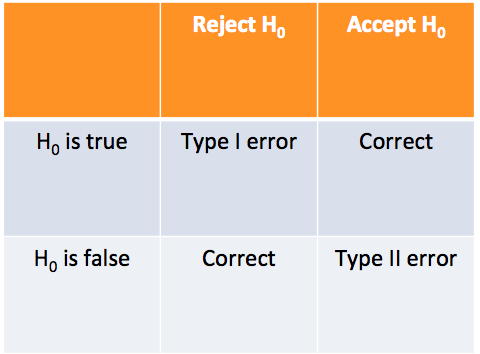
- Type of error
- det by significance lvl n statistical power
- type 1 error
- likely to happen when sig lvl is set at a higher level, when p<0.1. U reject Ho but it is true.
- type 2 error
- more likely to happen when statistical power is low. U accept Ho but it is false.
- power is det by probability level, sample size, effect size (deps on type of stat test) and types of stat test!
- more likely to happen when statistical power is low. U accept Ho but it is false.
- basic procedure. 1. raise a hypothesis. develop a null hypothesis. / 2. test the H. collect data, find evidence to rule out the H./ 3. draw the conclusion. p value, type 1 or 2 error, power.
using sample data to make inferences about population
Images and files in the map
Information
- Description
- Mind Map on data analysis II (inferential statistics), created by Sheri lyn on 29/03/2017.
- Created by
- Sheri lyn
- Views
- 0
- Rating