
Notes
Lecture 1
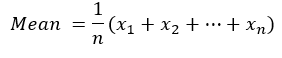
Content of the notes (2)
Page 1
Introduction to Business Analytics
Uncertainty- A situation where something is not know, or something that is not known or certain.
Probability, Statistics and Business Analytics are importance as it helps to handle data: Data Collection, Data Analysis and Data Interpretation. This provides support for judgement and decision making.
Key Measures:
Measures of Central Tendency
Median
The middle number - the numbers must be ordered and then the number that holds the middle value is the median.
If there are two "middle" numbers, this must be added and then divided by 2.
Mode
The mode is the number that appears most frequently within the data set.
Return-to- Risk Ratio
Return-to- Risk Ratio = Return / sd
Defined as where Return is a profit of an investment (change of value)
sd is the standard deviation of the sample
For example:
Expected return for company = 25% & Standard Deviation = 12.5
Return-to-Risk Ratio = 2 = 25/12.5
The Unit of the measurements can affect the mean and standard deviation.
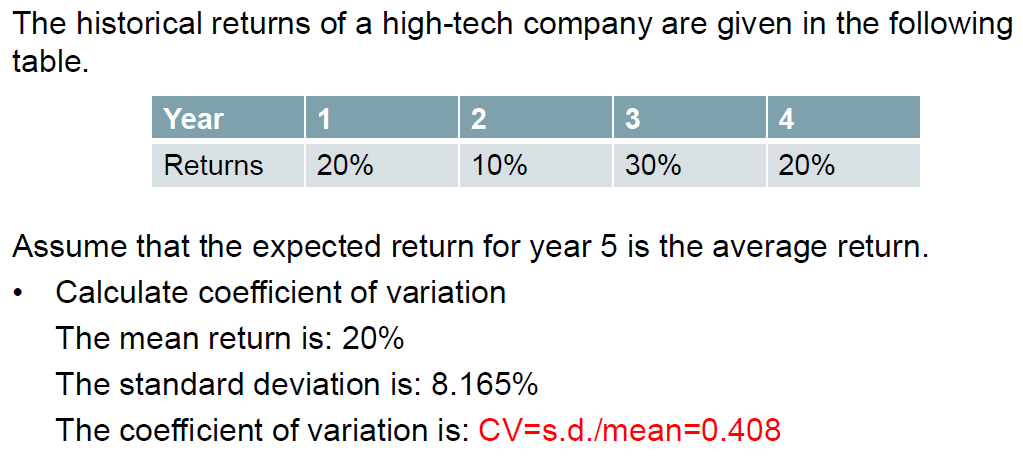
To get a measurement of dispersion which is independent of the units of measurement use Coeffcient of Variation (CV) - CV = sd/mean
Coeffcient of Variation is the inverse of Return-to-Risk Ratio
For Example:

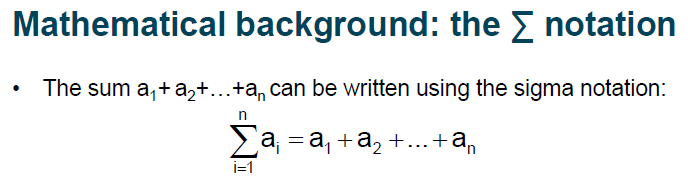
Measures of Dispersion/Spread of a Sample
Range
This is the area between an upper and lower limit on a particular scale.
For example: 123456789 the range of this data set = 1-9


Page 2
Information
- Description
- Business Analytics Note on Lecture 1, created by dilraj kaur on 26/03/2018.
- Created by
- dilraj kaur
- Views
- 25
- Tags
- Rating