
Notes
APES 5.3 and 6 TEST
Content of the notes (1)
Page 1
Population dynamics:
Study of how Density, dispersion and Age structure change in response to changes in environmental conditions.
Density:
Number of individuals in a certain area
Dispersion:
how a populations is dispersed in a specific area.
there is Clumping, Uniform and random disperisons.
Clumping is most common.
species cluster where there are resources
More likely to discover resources
protection from predators
hunting in packs can be easier
groups for mating/ caring for young
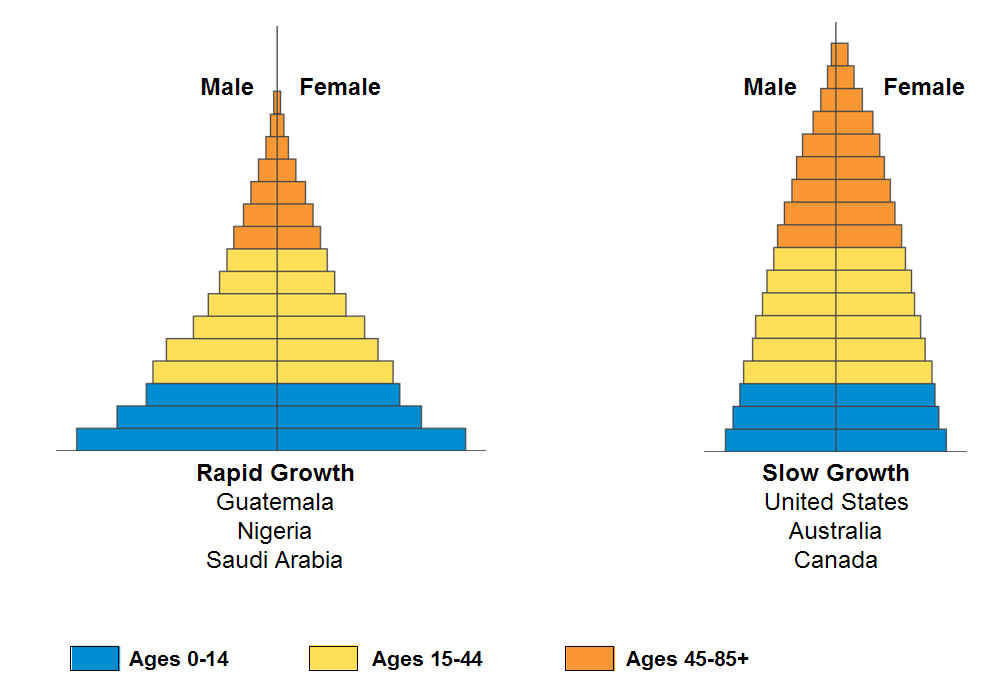
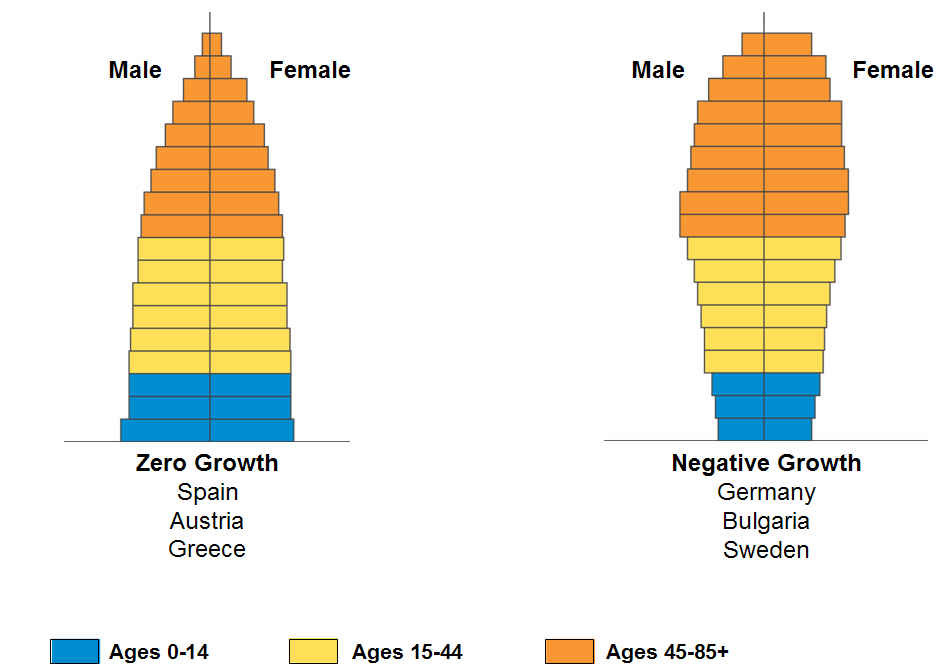
Age structure:
Proportions of individuals in different age groups
Pre-reproductive (0-14)
Reproductive (15-44)
post-reproductive (45+)
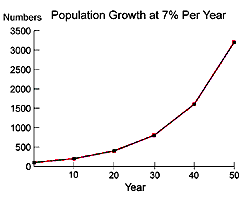
Exponential growth rate:
Occurs when resources are not limiting.
Population increases by a % as a whole in a given time
J shaped curved graph
Most populations under ideal conditions grow at exponential rates
Biotic potential:
Capacity for growth under ideal conditions
Intrinsic rate of growth (r):
rate at which a species would grow if it had unlimited resources and other ideal conditions
High intrinsic growth rate:
Reproduce early in life
many off spring
reproduce many times
short generation times
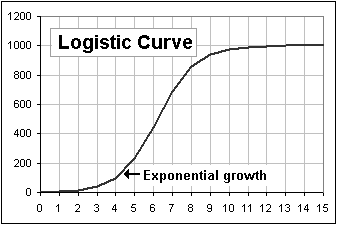
Logistic growth curve:
Occurs when resources become more and more limiting as population size increases.
S shaped graph- initially grows exponentially but plateaus at carrying capacity
it's not a fixed quantity and can changed with an increase or decrease in it's limiting factor
Carrying capacity:
the maximum number of organisms that a region can support without over using resources
The growth rate decreases as it reaches carrying capacity because the resources become limited
Environmental resistance:
Combination of all factors that act to limit the growth of a population.
it determines the carrying capacity both biotic and Abiotic
Three revolutions that increased Earths carrying capacity for humans:
Agricultural
Industrial
green
Exceeding the carrying capacity
Reproductive time lags:
the period needed for the birth rate to fall and the death rate to rise in response to resource over-consumption: they overshoot or exceed carrying capacity
Negative feedback loops:
result in oscillations or overshooting/ variable carrying capacity
Positive feedback loops:
cause a population to exponentially increase or decrease- not oscillate
Density Dependent:
A factor which limits the population that has a greater effect when populations density increases.
often due to negative feed back loops
tend to regulate the population at stable levels
ex: competition & infectious disease
Density independent:
limiting factor for a population that is not affected by populaiton density.
it does not matter if there is more organisms in the area it will still do the same amount of damage
Ex: Flood/ hurricane/ pollution
Common patterns of growth
Stable:
population that stays close to the carrying capacity
regulated by density dependent limiting factors
Irruptive:
Explosive growth followed by a crash either to a more stable or very low level
short lived/ rapidly reproducing species
Irregular:
No pattern- chaos in system
Cyclic (boom bust):
population fluctuates up and down
Top down control: predator interactions
Bottom up control: resource availability
R-strategist species:
environments where resources are not limiting
high intrinsic growth rates
low parental care
Opportunists- reproduce/ disperse rapidly
unstable/ cyclic cycles
may crash when more competitive species invade
early successional species
K-strategist species:
Environments where resources are limiting
lower intrinsic growth rates
live near their carrying capacity
strong big organisms that can compete for resources
low logistic growth curve
prone to extinction
late successional species
disadvantage- cannot rebound as quickly
Ecological succession:
Gradual change in species composition
replacement of species in a specific area
Primary succession:
establishment of biotic communities in lifeless areas and no soil
Secondary succession:
species grow in places that was wiped out but soil/ bottom sediment remained.
Population change
Population change =
(birth + immigration) – (deaths + emigration)
Crude birth and
death rates are given per 1000 people
Basic demographics
World population is 7.25 billion
US population is greater than 310 million
China and India make up 38% of the world's population
China is 1/5 of the worlds population
2050 the UN predicts that there will either be between 7.8 and 10.8 billion people- the average would be 9.3
top 5 most populated nations: china, India, US, Indonesia and Pakistan
Replacement fertility rate:
Number of children a couple must have to replace themselves.
Higher in developing countries (2.5) than developed countries (2.1) because of higher infant mortality rates.
Total fertility rate:
Average number of kids a woman has
it has decreased over the past few decades, but the amount of children under the age of 15 causes the population to continue increasing (population momentum)
worlds average (2.9) Developed (1.9) Developing (3.3)
Factors that decrease Fertility rate:
Education
Education/ employment opportunities for women
Availability in private/ public pensions
Decrease child labor
Increase urbanization
Decrease infant mortality
Higher average age of marriage
Increased cost of raising and educating children
birth control
legal abortions
Changes in religious beliefs, traditions, culture of encouraging large families
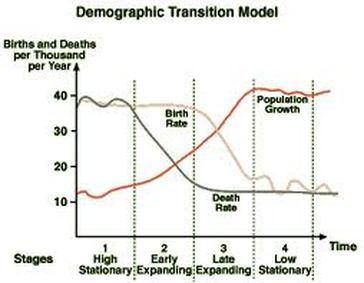
Demographic Transition Model
Preindustrial stage:
both birth and death rates are relatively balanced
population does not increase much
population size slowing
Transitional stage:
Death rate zero due to industrialization, increased food production, and health care
birth rates remain relatively higher
population increases rapidly
Industrial stage:
Birth rates drop
approaches a balance with death rates
slowing population growth
Post industrial stage:
Birth rate and death rates are basically balanced
zero population growth
population size stabilizes much higher than the preindustrial size
In 2002 there was an estimation of 40 million people living with AIDS in the world with 3.1 deaths that year caused by AIDS.
Russia's attempt to slow population decline: people started to really not have any kids and the government attempted to make big families look fun and healthy.
low birth rate, about 1.3
lower than the replacement level
China is expected to reach it's maximum around 1.46 billion in 2030 and start having negative growth in 2050.
India still has about 3.5 kids on average because of high poverty, gender imbalance, and pollution issues.
Developing nation- fast growing population
Future will have stable/ 0 population growth
Japan is a developed nation and has a negative population growth and will continue to have a negative population growth.
New Page
Information
- Description
- Note on APES 5.3 and 6 TEST , created by katiester22 on 24/11/2014.
- Created by
- katiester22
- Views
- 16
- Rating