
Notes
Organizing, Visualizing and Describing Data - created from Mind Map
Content of the notes (1)
Page 1
Classify Data
Central Tendency
Dispersion
Shape Of The DIstributions
Correlation between two variables
Statistical perspective
How they're collected
Numerical Data (Quantitative Data)
Catergorical Data (Quanlitative Data)
Def: Represent measured or counted quantities as a number
Continuous Data (Any numerical data)
Discrete Data (Finte Number)
Def: Describe a quality or characteristic
Nominal Data: Not amenable to being organized in a logical order
Ordinal Data: Can be logically ordered or ranked
Time series Data: collected over time
Cross-sectional Data: Collected at a point in time
Panel Data: a mix of Time and Cross
Mean
Mode: Most frequently occuring
Median: Middle item
Quantile: divide the distribution into
Arithmetic Mean: Average
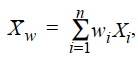
Weighted Mean: arises repeatedly in portfolio analysis
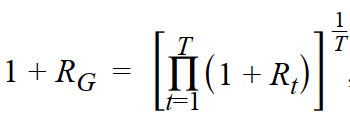
Geometric Mean: Used to average rates of change over time or to compute the growth rate of a variable
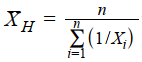
Harmonic Mean: may be viewed as a special type of weighted mean
Quartiles: into quarters
Quintiles into fifths
deciles into tenths
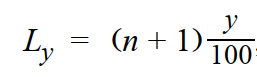
Percentiles into hundredths
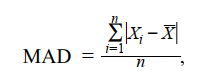
Mean Absolute Deviation
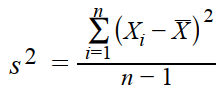
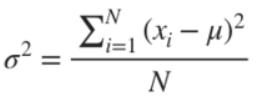
Variance
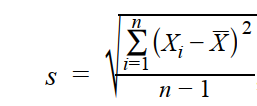
Standard Sample Deviation: the square root of the variance
Sample Target Downside/ Semi Deviation
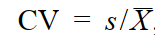
Coefficient of Variation: permits direct comparisons of dispersion across different datasets
Sample Variance
Variance
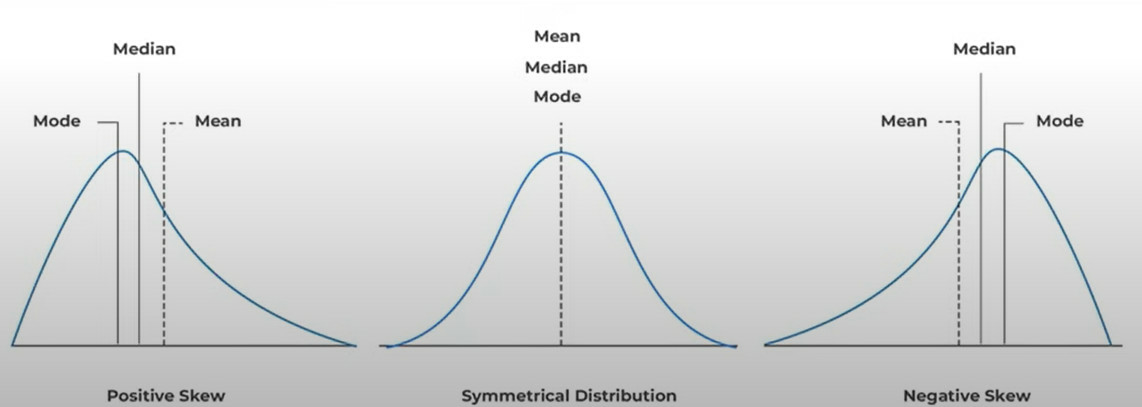
Normal DIstribution
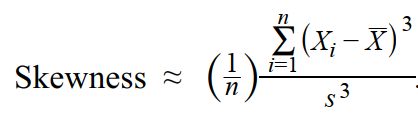
Skewed DIstribution
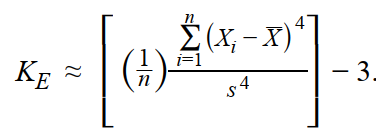
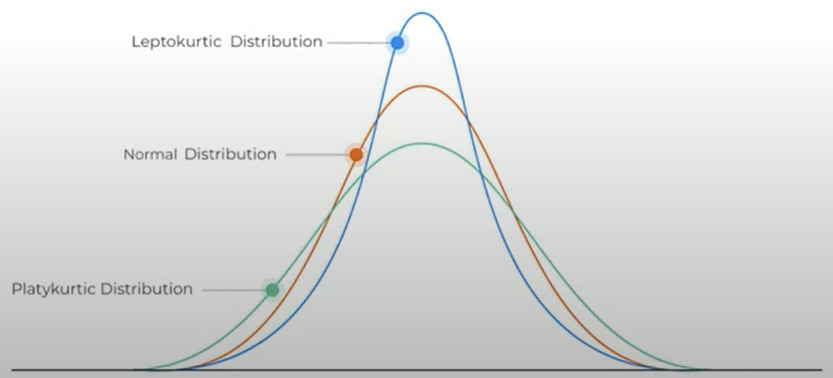
Kurtosis
Mean, Median and Mode are equal
Positively Skewed
Negatively Skill
Mesokurtic
Flatykurtic
Leptokurtic
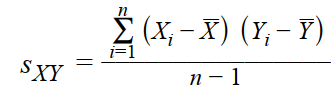
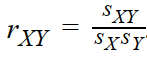
Covariance
Information
- Description
- Business/Economics Note on Organizing, Visualizing and Describing Data - created from Mind Map, created by Mau Hoang on 14/12/2022.
- Created by
- Mau Hoang
- Views
- 0
- History
-
- Created by Mau Hoang · Dec 14, 2022
- Copied to Note by Mau Hoang · Dec 14, 2022
- Rating