
Flashcards
Inferential statistics
Flashcards do conjunto (18)
- 1Why sample and estimate?Performing a census is almost always impossible (resource intensive and population movement). Sampling allows for the creation of models to represent the target population from which inferences can be made. Calculation of the error between the model and the target population is also required to determine how accurate the model is.
- 2What is point estimation?The estimation of a single value statistic (e.g. the mean height of the sample population). The sample mean is an estimation of the target population mean.
- 3What is interval estimation?Defined by two values between which the population parameter (e.g. mean height of men aged 18-45 currently residing in the UK) is expected to lie, with a high degree of probability (e.g. Confidence value of 95%).
- 4Why is the sampling method important?Estimations and inferences are only valid if the model is representative of the target population. The sampling method recruits elements (e.g. people) for the model.
- 5What is a parameter?A descriptive characteristic of the target population (e.g. Mean height of men aged 18-45 currently residing in the UK).
- 6What is a statistic?An inferred characteristic of the target population (e.g. Mean height of men in the sample population).
- 7What is the central limit theorem?It is the theory that if multiple samples are collected from the same target population, their means calculated and plotted on a histogram, the sampling distribution would approximate into a normal distribution. This is regardless of what the target population distribution shape really is.
The larger the number of sample means, the closer the sample distribution is to a normal distribution. Likewise, the closer the target population distribution is, the fewer sample means are required. - 8How can you determine how accurate the model is to the target population?Estimations of a population parameter are derived from point estimates. As point estimates are drawn from a theoretical sampling distribution of all possible means (central limit theorem), the variation associated with this distribution can model the error of the point estimate.
- 9What is a standard deviation?It is the variation within actual observed data.
- 10What is a standard error?The variation within statistics derived from actual observed data. It is the standard deviation of the sampling distribution.
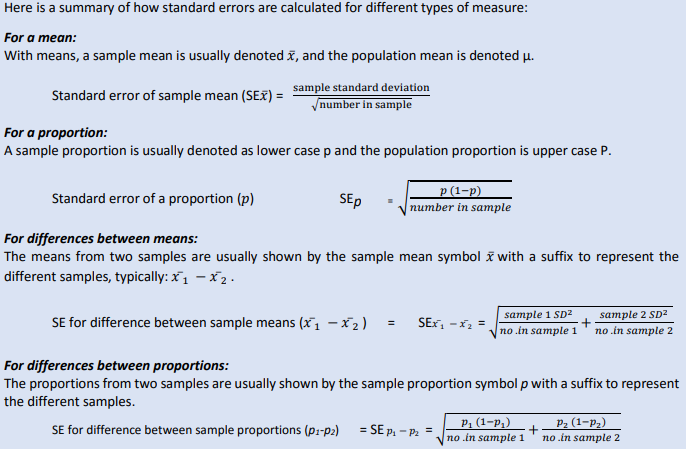
- 11How is the standard error calculated?These formulae should be provided in the exam.
- 12What is a confidence level?The degree of certainty that the results would fall within the confidence interval if the same study was repeated.
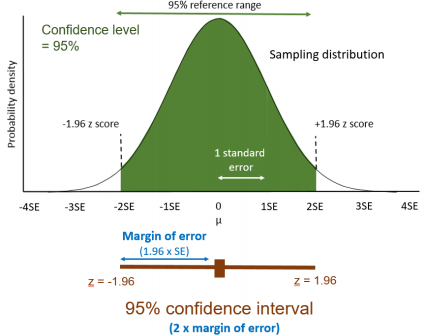
- 13What is a confidence interval?The range of values the true population parameter is expected to lie within. It is defined as the Margin of Error (MoE) either side of the sample mean. It describes the uncertainty associated with a sample estimation of a population parameter.
- 14What is precision?Also known as the Margin of Error (MoE). It is the level of precision deemed acceptable by the researcher for their study.
- 15What is a T distribution?It is a probability distribution model similar to a Normal distribution. With sample sizes < 40, t-scores should be used instead of z-scores to calculate the Margin of Error (MoE). At larger sample sizes, the T distribution approximates to a Normal distribution and z-scores are acceptable to use instead.
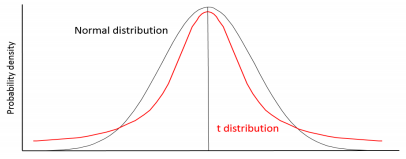
- 16How do you calculate a t-score?The degree of freedom must be determined. This is simply the sample size - 1. A T distribution table can then be assessed.
- 17How do you calculate confidence intervals for ratios? (e.g. odds ratios)Ratios don't follow a normal distribution so they must be transformed into values that can be normally distributed. This is done by converting them into logarithmic form, through ln(ratio). Once the confidence interval's logarithmic form is calculated, the reverse log must be performed to acquire the true confidence interval. This is done by inputting it into the exponential function, e.
- 18How can you tell if a ratio is significant?Either through a p test or by assessing the confidence interval. A ratio with no difference between the two variables will equal 1. If the confidence interval crosses the point of no difference (1), then the result is unlikely to be statistically significant.
Informações
- Descrição
- Public Health FlashCards sobre Inferential statistics, criado por Ralfh Pulmones em 09-11-2019.
- Criado por
- Ralfh Pulmones
- Visualizações
- 40
- Avaliação