
Flashcards
Unit 4 - Linear Regression
Flashcards do conjunto (21)
- 1A Least Squares Regression Line was calculated as: y-hat = 100 - 2x. What is the residual, and corresponding relationship with the LSRL, for an observed point of (25, 20)?-30, the LSRL overpredicted y
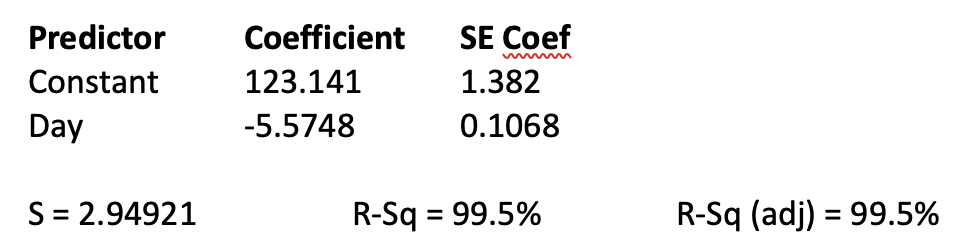
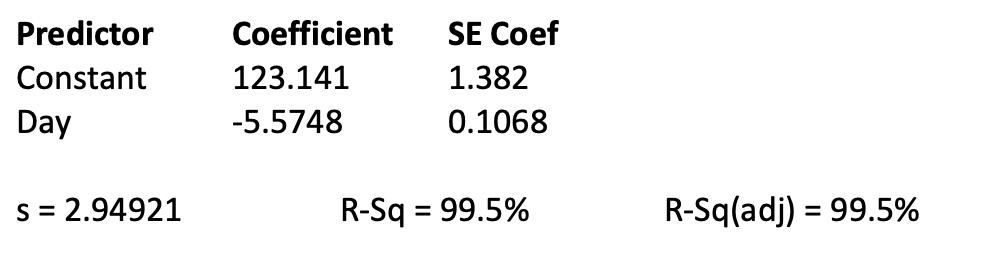
- 2The data, showing the weight of soap and the number of days the soap has been used for a random sample of 15 bars of soap results in the partial regression analysis shown below: What is the equation of the line least squares regression line?predicted weight of soap = 123.141 - 5.5748(number of days of soap use)
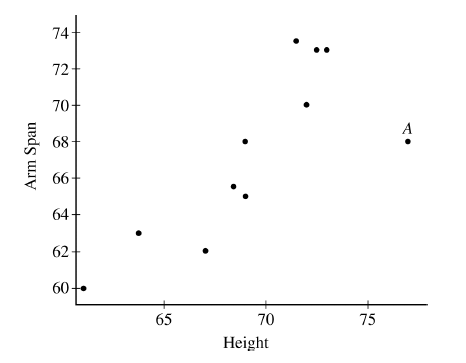
- 3A scatterplot of student height, in inches, versus corresponding arm span length, in inches, is shown below. One of the points in the graph is labeled A. If the point labeled A is removed, which of the following statements would be true?The slope of the least squares regression line increases and the correlation coefficient increases.
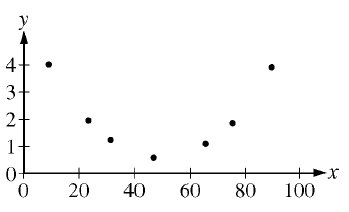
- 4For which of the following scatterplots is the correlation between x and y closest to 0 ?
- 5A recent study was conducted for a national consumer magazine to provide information to help consumers when purchasing computer tablets. Three of the variables in the study included price, battery life, and weight of the tablet (including battery). The following table summarizes the data collected: What is the LSRL if battery life is the explanatory variable and weight is the response variable?ŷ = 1.748 + 0.146x

- 6An exponential relationship exists between the explanatory variable and the response variable in a set of data. The common logarithm of each value of the response variable is taken, and the least-squares regression line has an equation of log(yˆ)=7.3−1.5x. Which of the following is closest to the predicted value of the response variable for x=4.8 ?1.26
Substituting x=4.8 into the equation gives log(yˆ)=7.3−1.5(4.8) or log(yˆ)=0.1. To solve for yˆ, raise 10 to the power of 0.1 to get 1.26. - 7A recent study was conducted for a national consumer magazine to provide information to help consumers when purchasing computer tablets. Three of the variables in the study included price, battery life, and weight of the tablet (including battery). The following table summarizes the data collected: If a least squares regression line is calculated for predicted weight and battery life, can the same LSRL be used to predict battery life for a given weight if there is a strong linear relationship between the two variables?No, the LSRL of predicted weight and battery life should not be used to predict battery life for a given weight no matter how strong the correlation is.

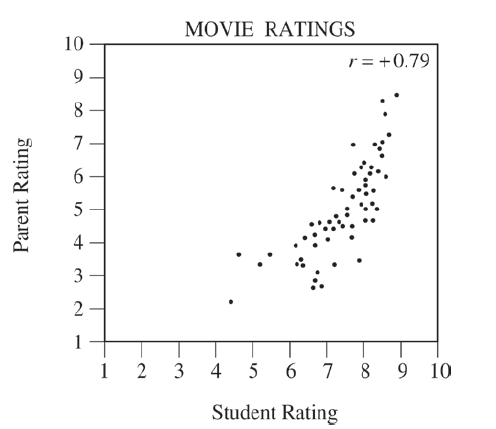
- 8In a recent survey, high school students and their parents were asked to rate 60 recently released movies. The ratings were on a scale from 1 to 9, where 1 was “horrible” and 9 was “excellent”. For each movie, the average rating by the students and the average rating by their parents was calculated and the scatterplot below was constructed.The horizontal axis represents the student rating, and the vertical axis represents the parent rating.Thus, an individual data point would represent the rating of a single movie. Which of the following statements is justified by the scatterplot?The movies that the students liked the best also tended to be the movies that the parents liked the best, but the students tended to give higher scores.
- 9There is a linear relationship between the number of chirps made by the striped ground cricket and the air temperature. A least squares fit of some data collected by a biologist gives the model ŷ = 25.2 + 3.3x 9 < x < 25, where x is the number of chirps per minute and ŷ is the estimated temperature in degrees Fahrenheit. What is the estimated increase in temperature that corresponds to an increase of 5 chirps per minute?16.5 ° F
- 10The relationship between carbon dioxide emissions and fuel efficiency of a certain car can be modeled by the least-squares regression equation ln(yˆ)=7−0.045x, where x represents the fuel efficiency, in miles per gallon, and yˆ represents the predicted carbon dioxide emissions, in grams per mile. Which of the following is closest to the predicted carbon dioxide emissions, in grams per mile, for a car of this type with a fuel efficiency of 20 miles per gallon?446
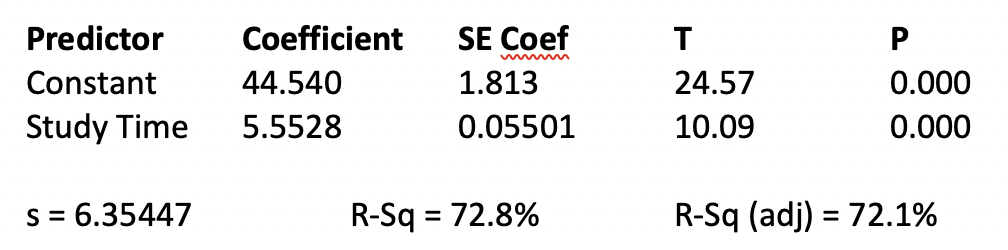
When 20 is substituted for x, the resulting value on the right side of the equation is 6.1. The value of approximately 446 results from raising e to the power of 6.1 (that is,e6.1). - 11The administration at Plano ISD wants to determine if a students' test scores last spring were related to the amount of time doing homework each week during remote learning. To perform this analysis, data was collected for 40 students who studied between 2 and 10 hours per week during that time period. A computer software package was used to generate the following computer output. What is the equation for the least squares regression line?ŷ = 44.540 + 5.5528x
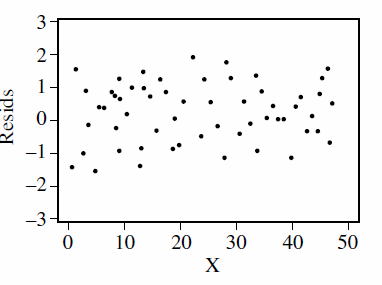
- 12The residual plots from five different least squares regression lines are shown below. Which of the plots provides the strongest evidence that its regression line is an appropriate model for the data and is consistent with the assumptions required for inference for regression?
- 13At a large airport, data were recorded for one month on how many baggage items were unloaded from each flight upon arrival as well as the time required to deliver all the baggage items on the flight to the baggage claim area. A scatterplot of the two variables indicated a strong, positive linear association between the variables. Which of the following statements is a correct interpretation of the word “strong” in the description of the association?The actual time required to deliver all the items to the baggage claim area based on the number of items unloaded will be very close to the time predicted by a least-squares model.
- 14Sandy and Sam were having a discussion regarding high-leverage points, outliers, and influential points. Identify which of the following statement(s) that Sam made are true: 1. A point with a large residual compared to all other residuals is an outlier. 2. A high-leverage point has a y-value that is significantly different than y-bar. 3. The addition of an influential point to the data set could change the slope of the LSRL.1 and 3 only
- 15The data, showing the weight of soap and the number of days the soap has been used for a random sample of 15 bars of soap results in the partial regression analysis shown below: Identify and interpret the correlation coefficient.r = -0.997, There is a strong, negative, linear relationship between days of soap use and weight of the soap.
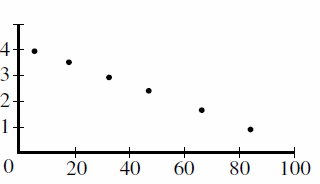
- 16Which of the following scatterplots could represent a data set with a correlation coefficient of r = -1?
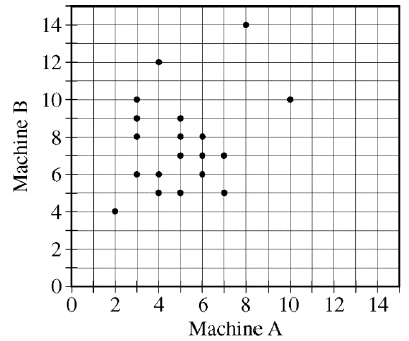
- 17A factory has two machines, A and B, making the same part for refrigerators. The number of defective parts produced by each machine during the first hour of operation was recorded on 19 randomly selected days. The scatterplot below shows the number of defective parts produced by each machine on the selected days. Which statement gives the best comparison between the number of defective parts produced by the machines during the first hour of operation on the 19 days?Machine A usually, but not always, produced fewer defective parts than machine B.
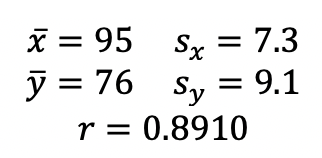
- 18An event planner wants to investigate if there is a relationship between the number of invitations that are sent for an event (x) and the number of guests that actually attend the event (y). In a random sample of the last 50 events planned, she found the following summary statistics: Which of the following could be the least squares regression line for these statistics?predicted number of guests = -29.516 + 1.111(number of invitations sent)
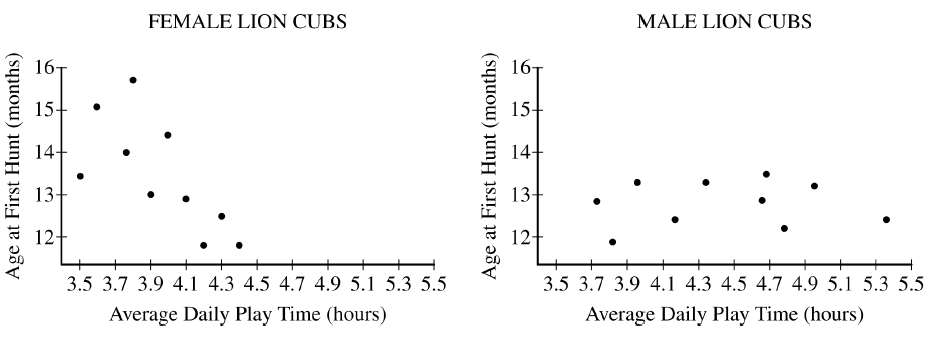
- 19A field researcher who studies lions conjectured that the more time a cub spends playing, the sooner the cub will begin to hunt. Observational data were collected from 20 lion cubs. The researcher recorded how long they spent playing and the age when they began hunting. Because male and female lions have different hunting behaviors, the researcher recorded the data for males and females separately. The two scatterplots show the data for the 10 female lions and the 10 male lions. Based on the scatterplots, for which gender does there appear to be evidence that the more time a lion cub spends playing, the sooner the cub is likely to begin hunting?For female cubs only
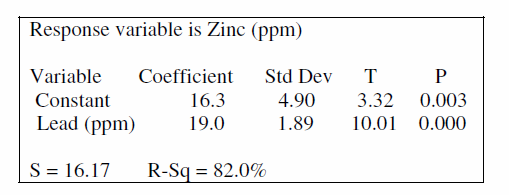
- 20The computer output below shows the result of a linear regression analysis for predicting the concentration of zinc, in parts per million (ppm), from the concentration of lead, in ppm, found in fish from a certain river. Which of the following statements is a correct interpretation of the value 19.0 in the output?On average there is a predicted increase of 19.0 ppm in concentration of zinc for every increase of 1 ppm in concentration of lead found in the fish.
- 21The number of paid admissions and number of days over 100 degrees was tracked for 10 summer seasons at a local theme park. Which of the following statements is correct based on the least-squares regression line (LSRL) developed from the data if days over 100 degrees is the explanatory variable, paid admissions is the response variable, and the correlation coefficient is -0.23?The proportion of the variation in number of ticket sales explained by the LSRL of paid admissions and days over 100 degrees is approximately 5.29%.
Informações
- Descrição
- 10th grade Math FlashCards sobre Unit 4 - Linear Regression, criado por Kelly Chen em 02-05-2021.
- Criado por
- Kelly Chen
- Visualizações
- 1
- Avaliação